Our Interesting Sun
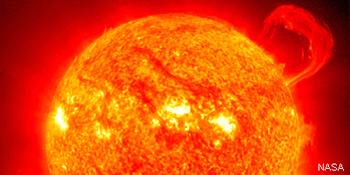
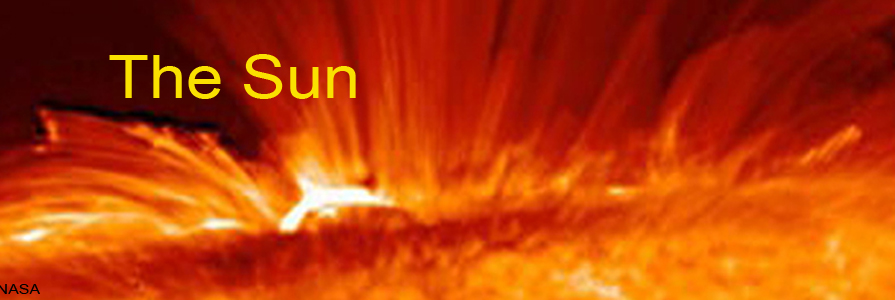
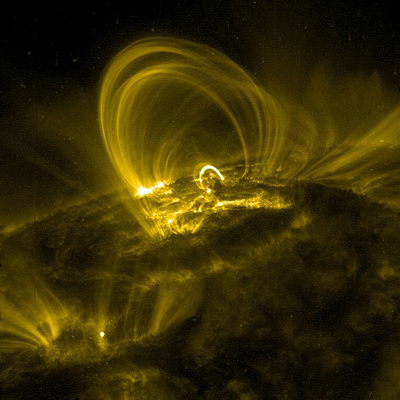
Our sun's color is white, although from the surface of the earth it appears orange/yellow because of atmospheric scattering. The spectacular picture to the left shows the sun's granular surface, a few surface flares, and an amazing edge prominence called the "Handle". The sun's surface temperature is 5,800 Kelvin or about 10,000 °F. But... the temperature of its core is 15,700,000 Kelvin! The sun's diameter is 865,000 miles, which is 109 times that of the earth. Its surface area is approximately 12,000 times that of the earth. The sun's mass is 333,000 times that of earth and is about 99.9% of the total mass of our whole solar system. 73% of the sun's mass is hydrogen while 25% is helium. The 2% rest consists of heavier elements: oxygen, carbon, iron and a smattering of other elements.
The sun is about 93 million miles on average from earth's orbit, which is known as one Astronomical Unit (1 AU). It takes light 8 minutes and 19 seconds to travel this distance. The sun revolves around the galactic center of the Milky Way at a radius of approximately 26,000 light years. It completes its orbit once every 235 million years. The sun's orbital velocity with respect to the Cosmic Microwave Background (CMB) is about 828,000 miles per hour.
Because the sun exists in a plasma state and behaves like a heavy fluid (not a solid) it rotates faster at its equator than at its poles. This is known as differential rotation (see Convection Zone below), and is caused by fluid rotational differences in the sun's interior due to steep temperature gradients from its core outwards. The sun's period of rotation is 25.6 days at the equator and 33.5 days at the poles. However, due to our constantly changing vantage point from the earth as it orbits the sun, the apparent rotation of the sun at its equator is about 28 days. Top
The Sun's Regions
The sun does not have a definite boundary as rocky planets do. In its outer parts the density of its gases drops exponentially with increasing distance from its center. Nevertheless, it has a well-defined interior structure. The Sun's radius is measured from its "Core" to the edge of the "Photosphere". This is the layer above which gases are too cool to radiate light, and is therefore the surface visible to the naked eye.
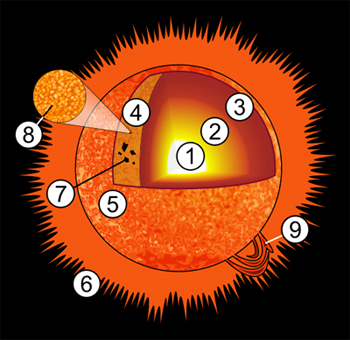
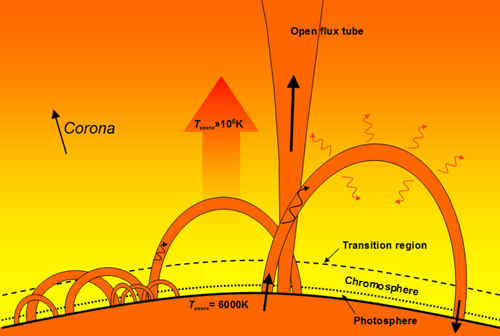
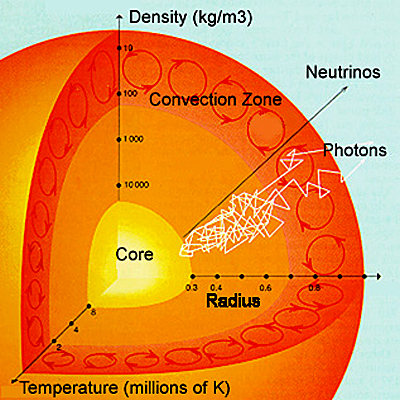
The sketch to the left illustrates the various sections of the sun's interior and some exterior features. These are discussed below:
- 1. Core.
- 2. Radiative Zone
- 3. Convection Zone
- 4. Photosphere
- 5. Chromosphere
- 6. Corona
- 7. Sunspots
- 8. Granules
- 9. Prominence
1.) The Core of the sun is considered to extend from the center to about 25% of the solar radius. It has a density of about 150 times the density of water. The Core is the only section of the sun that produces heat through fusion. The temperature is 15,700,000 K! The rest of the sun is heated by energy that is transferred outward from the Core. The energy produced by fusion in the Core must travel through successive layers to the Photosphere before it escapes into space as sunlight.
2.) The Radiative Zone, from 25% to 70% of the solar radius, the Radiative material is hot and dense enough that thermal radiation (not fusion) transfers the intense heat of the Core outward. Heat is transferred by photon radiation. Very hot ions of hydrogen and helium emit photons which are absorbed in only a few millimeters of solar plasma and then are re-emitted again in random directions. This random radiation process takes a very long time for photons to reach the sun's surface as sunlight. Estimates of the "photon travel time" range from 10,000 to 170,000 years! The plasma density drops a hundredfold from the bottom to the top of the Radiative Zone. Between the Radiative Zone and the Convection Zone is a very narrow transition layer called the Tachocline. The Radiative Zone rotates like a normal solid body. The Tachocline is a region between the uniform solid rotation of the Radiative Zone and the conventional fluid rotation of the Convection Zone. The Tachocline's plasma rotation rate changes very rapidly causing an extreme shear - a situation where successive horizontal layers slide past one another.
3.) The Convection Zone rotates as a normal fluid with "differential rotation". That is, the plasma at the poles rotates slowly (33.5 days) with the convection current speeds constantly increasing until they reach the plasma equator which rotates much faster (25.6 days). In the Convection layer, from its surface down 30% of the solar radius, the Convection plasma is not dense or hot enough to transfer the heat energy of the interior outward through radiation. As a result, thermal convection occurs as thermal columns carry hot material to the Photosphere surface of the sun. Once the material cools off at the surface, it plunges downward to the base of the Convective Zone, to absorb more heat from the top of the Radiative Zone and then repeats the cycle. These thermal columns in the Convection Zone form an imprint on the surface of the sun and are called Solar Granules. In addition there are "rivers" of plasma flowing from the poles to the equator deep in the Convection Zone then up to the surface and back to the poles. See the Sun's Conveyor Belts.
4.) The Photosphere - the visible surface of the sun, is the layer below which the sun becomes opaque. Above the Photosphere, sunlight is free to propagate into space and its energy escapes the sun entirely. The visible light we see is produced as electrons react with hydrogen atoms to produce hydrogen ions. The Photosphere is hundreds of kilometers thick. Because the upper part of the Photosphere is cooler than the lower part, an image of the sun appears brighter in the center than on the edge.
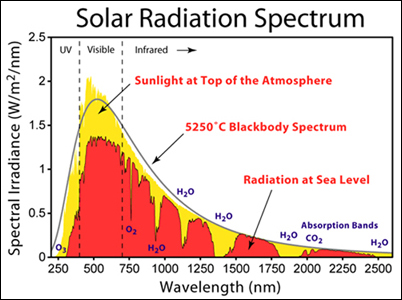
Shown in the diagram at the left is how the energy from the sun is distributed by wavelength and photon energy. A nice 46% of the radiation is in the visible range. Another 49% is in the infrared range which we feel as heat. The remaining 5% is in the ultraviolet range which tans the skin. During early studies of the photosphere, some absorption lines were found in the solar spectrum that did not correspond to any chemicals then known on Earth. In 1868, Norman Lockyer hypothesized that these absorption lines were a new element which he dubbed "helium", after the Greek Sun God Helios. It was 25 years later that helium was isolated on Earth.
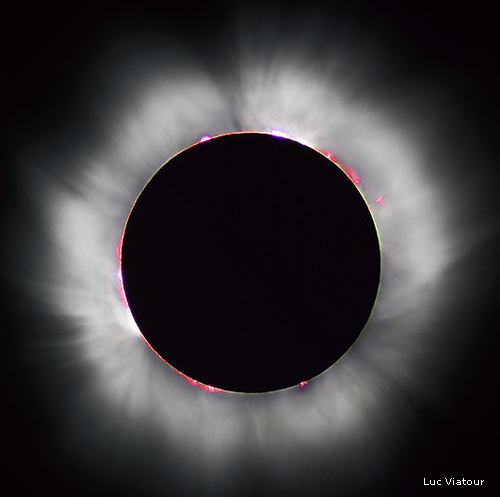
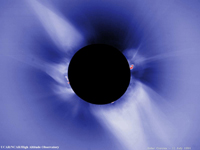
5.) The Chromosphere is a layer of hot gases about 2,500 kilometers thick. The Chromosphere cannot normally be seen because it is washed out by the over-whelming brightness of the Photosphere. However, the remarkable picture of the Chromosphere on the left was taken by Luc Viatour of France during the 1999 total eclipse of the sun at just the right moment. During eclipses of the sun the Chromosphere can be seen by the naked eye. The temperature in the Chromosphere "increases" gradually, ranging from 4,000 K at its bottom to 20,000 K at the top.
6.) The Corona is the outer atmosphere of the Sun which is extremely large. In the lower part of the Corona is a thin "Transition Layer" (about 120 miles thick) in which the temperatures rise from 20,000 K at the bottom of the Transition Layer to temperatures of 1,000,000 K and above! How this happens is a solar mystery. The average temperature of the Corona is 1,000,000 to 2,000,000 K. However, in the hottest regions it is 8,000,000 to an unbelievable 20,000,000 K! The Corona continuously extends into outer space forming the Solar Wind.
7.) Sunspots are a temporary phenomena on the surface of the Photosphere that appear as dark spots compared to the surrounding regions. They are caused by intense magnetic activity, which inhibits convection, forming areas of lower surface temperatures. If a Sunspot were isolated from its surrounding Photosphere, it would be brighter than an electric arc. Sunspots expand and contract as they move across the surface of the sun.
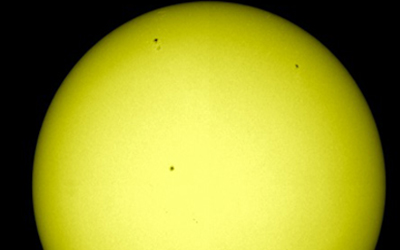
They can be as large as 50,000 miles in diameter making the larger ones visible from Earth. To the left are three sunspots in the suns's northern hemisphere as seen on July 7, 2011. See the Sunspot section immediately below for more information.
8.) Solar Granules are very hot thermal columns formed in the Convection Zone which rise to the surface of the Photoshere, cool down, and then plunge back down to the base of the Convetion Zone, receive more heat from the Radiative Zone, then cycle up and down again.
The grainy appearance of the Photosphere is produced by the tops of these Convection cells. A typical Granule has a diameter of about 600 miles and lasts only 8 to 20 minutes before dissipating. Just below the Photosphere is a layer of "Super Granules", up to 20,000 miles in diameter whose life span is up to 24 hours.
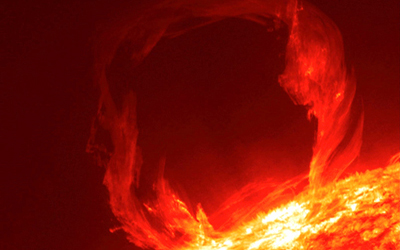
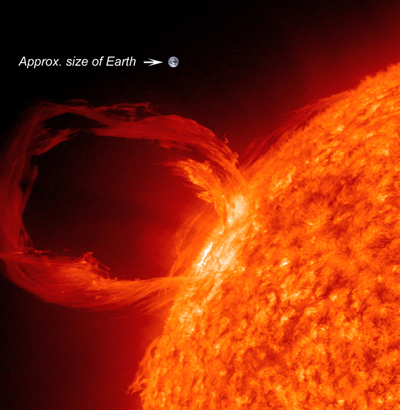
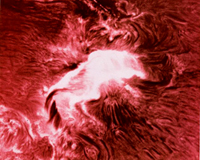
9.) Solar Prominences rise up through the Chromosphere from the Photosphere, sometimes reaching altitudes of 100,000 miles. These gigantic plumes of gases, often in a loop shape, are the most spectacular of the solar phenomena. The Prominence at the left was recorded in April, 2010.
While the Corona consists of extremely hot ionized gases which do not emit much visible light, Prominences contain much cooler plasma which emit quite a bit of light. The mass within a Prominence is typically on the order of 100 billion tons. A Prominence forms in about a day and if stable can persist in the Corona for several months.
Some Prominences break apart and morph into Coronal Mass Ejections (CMEs). Scientists are currently researching how Prominences and CMEs are formed and ejected. It is believed that they are caused by intense magnetic activity beneath the surface of the Photosphere. See the NASA CME Video. Top
Sunspot Cycles
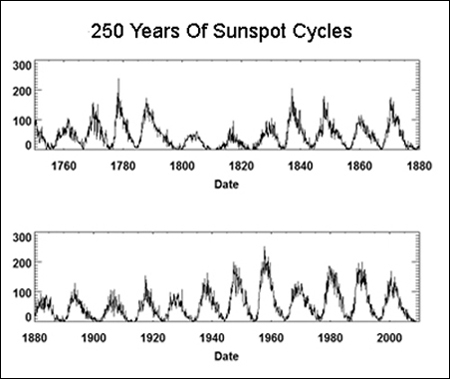
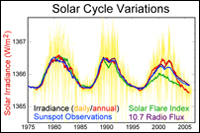
Sunspot "cycles" were first observed in 1843 by Samuel Schwabe, who after 17 years of observations, noticed the cyclical pattern. The idea of standardizing the method of counting sunspots was initiated by Rudolf Wolf in 1848 and his counting methodology has been continued to this day. Sunspots have been recorded since Galileo in the early 1600's. However it was about 150 years later that Schwabe observed the cycles in the sunspots to be approximately 11 years.
Sunspot cycles have been accurately measured for the past 250 years. The chart at the left shows cycles 1 through 23. In 1919 George Hale showed that the sunspot cycles coincided with the sun's magnetic cycles. However the magnetic cycle was a 22 year cycle, double the 11 year sunspot cycle. Sunspots are a very good measure of the sun's internal magnetic activity and of its surface activity, i.e. flares, prominences, CMEs, etc. It is now believed that the twisting magnetic action in the plasma Convection Zone below the sun's surface causes sunspots to form, flares, etc. to form, and the sun's magnetic field to reverse itself every 22 years. (The earth's magnetic field also reverses itself, but only about once every million years. These reversals are recorded in rocks and their signatures can be seen in striped magnetic formations on the ocean floor.) For much more information on sunspot activity, see the Sunspots Page. on our sister web site.
Coronal Loops
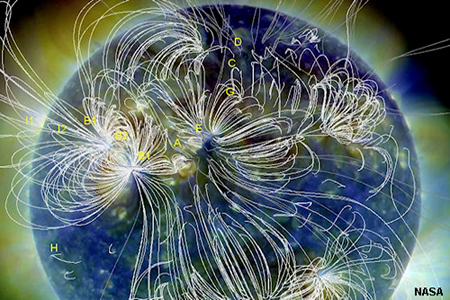
A coronal loop is a loop of magnetic flux filled with plasma anchored at both ends into the Photosphere and extending well into the Corona. Coronal loops come in many sizes. Some are quite small extending only into the Chromosphere, 1,500 miles. Others extend well into the Corona and can be as high as 100,000 miles. See the diagram below left.
One can mentally picture that underneath a coronal loop is a huge horseshoe magnet with a north and a south pole. The magnetic flux extends from one pole up into the Corona and then back down into the other pole. However, the coronal loops are dynamic. They can last anywhere from a day to months. They also get pushed around by the flow of the plasma. The number of coronal loops is directly linked to the solar cycle, i.e. when the sun is very active there are many coronal loops and vice versa. Coronal loops are often found with sunspots within their larger footprint.
Coronal loops have a wide variance in their energy and temperatures. Those under one million degrees Kelvin (1 MK) are referred to as cool loops. Those around 1MK are warm loops and those over 1MK are called hot loops. The different categories produce radiation of different wavelengths.
How do the coronal magnetic loop fields form? Just beneath the surface of the Photosphere there are small scale magnetic fields forming all the time. These local fields form a thick carpet-like surface of revolving plasma currents circu-
lating in small vertical loops as the heat from the radiation zone makes its way to the surface through the convection zone. See the sun cutaway chart below this section showing the revolving vertical loops in the convection zone.
Separately there are also large currents flowing from the poles deep underneath the surface to the equator, then up to the surface and back again to the poles, referred to as the sun's Conveyor Belts.. In addition, the convection zone is rotating, but in a "differential" way. Meaning the plasma at the equator is rotating faster than the plasma at the poles thus causing many shears in the east-west flow from the equator to the poles.
So we have three conflicting plasma flows: vertical loops from the bottom of the convection floor to the surface, north-south conveyor belts, and east-west rotational shears. This results in the various magnetic fields becoming tangled and twisted causing a the build up of stored magnetic energy. At some point there is a release of this magnetic energy as the magnetic fields re-configure themselves into a lower energy state and the excess energy is converted into kinetic and thermal energy. This results in an ejection of plasma into the corona as the plasma follows the new magnetic field lines. Some ejections are bigger than others causing the coronal loops to be of different sizes.
At the poles a slightly different phenomenon takes place. Instead of the loops being closed, most of them are open and for an extended period of time. In this case the plasma is shot out into outer space and forms the "fast" solar wind. The solar wind has two components - the "slow" wind and the "fast" wind. The slow wind travels about 400 km/sec. whereas the fast wind travels about 750 km/sec. The slow solar wind appears to originate from a region around the sun's equatorial belt that is known as the "streamer belt". The fast solar wind originates from "coronal holes" which are funnel-like regions of open field lines at the sun's poles. Top
How Exactly Does The Sun Radiate Energy?
First a quick review of how energy traverses the sun's regions. Nuclear fusion takes place in the sun's core. Energy then moves by photon radiation through the radiation zone (no fusion) to the convection zone. The energy in the form of heat then moves by convection to the surface. Convection is the flow of heat through a fluid, in this case plasma. (Convection does not occur in solids.) Convection takes place in one of two ways: by the random interaction of high energy (heated) particles (Brownian Motion) and by the flow of heated currents in the fluid plasma. Once the energy reaches the sun's surface it is mainly transmitted by rays (photons) and the solar wind (particles) to the rest of the the heliosphere.
What exactly is fusion? Fusion is a process whereby 4 hydrogen nuclei at very high temperatures and pressure are burned into one helium nuclei plus some other particles and a lot of energy. The 4 hydrogen nuclei weigh more than the single helium nucleus and other particles. The balance of lost weight (mass) is converted into energy. In summary, the fusion process yields a helium nucleus, which contains 2 protons and 2 neutrons, plus 2 electrons plus 2 neutrinos and a lot of energy (photons). Because of Einstein's equation E=mc^2, a small amount of mass gets multiplied by the square of the speed of light (a very large number) resulting in a huge amount of energy being released from a small amount of mass (similar to a nuclear bomb).
A huge number of neutrinos are also released by the fusion process. However, neutrinos rarely interact with other bits of matter. About a hundred billion neutrinos pass through your fingernails every second and we are completely unaware of them and they do no harm. A solar neutrino passing completely through the earth has about one chance in a thousand billion of being stopped by another particle. However, using 100,000 gallons of special fluids and very delicate sensing devices, neutinos have been detected and measured. This experimental technique was used to verify the theory of nuclear fusion as the engine of energy in the core of our sun and other stars. Top
The Sun's Magnetic Properties
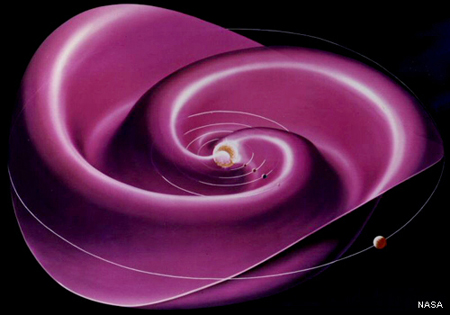
The sun is a very active "magnetic star". Its internal regions are 100% plasma. Plasma is a gas whose temperature has risen to such a high level that it becomes sensitive to magnetism. The sun's rotating magnetic fields affect the gases of the Solar Wind creating the Magnetic Current Sheet, which is a humongous continuous magnetic wave of ion particles in the Heliosphere. The spiral wavy shape, known as the Parker Spiral illustrated on the left, can be compared to a rotating lawn sprinkler, except that the waves keep growing until they encounter the Termination Shock. Extending throughout the Heliosphere, the Magnetic Current Sheet is considered the largest structure in our solar system. The sun's strong changing magnetic field varies from year to year and amazingly reverses itself on average every 10.7 years. The "differential rotation" of the Convection Zone (explained above in the Convection Zone section) causes the magnetic field lines to become twisted over time which then causes magnetic field loops to erupt on the sun's surface triggering the formation of dramatic Solar Prominences and Coronal Mass Ejections (CMEs).
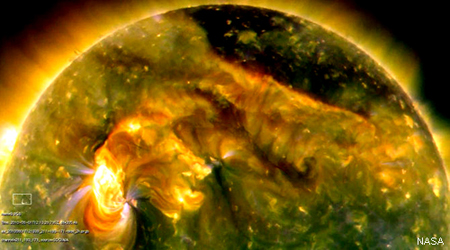
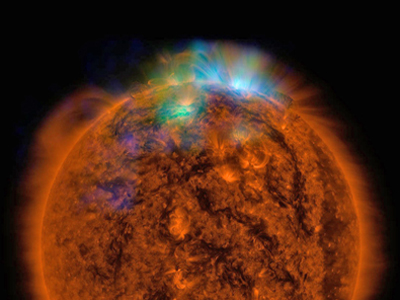
The ultraviolet photo on the left from NASA's Solar Dynamic Laboratory (SDO) shows the sun's whole northern hemisphere exploding as examples of huge Solar Flares and a Coronal Mass Ejection. Different colors in the image represent different gas temperatures. Here is a quote from NASA,: "On August 1, 2010, almost the entire earth facing side of the sun erupted in a tumult of activity. This image shows the large solar flare (white area on the left), a solar tsunami (wave-like structure upper right) multiple filaments of magnetism lifting off the stellar surface, large scale shaking of the solar Corona, radio bursts, a Coronal Mass Ejection, and more."
For three months NASA scientists worked hard to understand what really happened on August 1st, 2010. The events on the sun's surface were not isolated events, they were all magnetically collated into one
massive instantaneous explosion. NASA announced "Explosions on the sun are not localized or isolated events. Instead, solar activity is interconnected by magnetism over breathtaking distances. Solar Flares, Tsunamis, Coronal Mass Ejections - they can go off all at once, hundreds of thousands of miles apart, in a dizzyingly complex concert of mayhem". The magnetic forces were traced by the SDO spacecraft. Previously these types of events were thought to be isolated from one another. While scientists know a lot about what happened that day, they are still trying to piece together the causes. It may be that a new theory has to evolve to explain massive explosions like this one. Not all explosions are massive, so there may be more than one type of activity going on.
The CME from August 1st, 2010 headed directly towards the earth and three days later the earth's magnetic field reverberated from the CME's impact which sparked auroras as far south as Wisconsin and Iowa. However, this particular intense solar storm was an exception. Weeks and sometimes a month had gone by without a single sunspot. The sun in August, 2010 was coming out of a exceptionally long low period of sun activity, longest low in more than a century. Sun activity cycles are measured by the number of sunspots recorded in a given year. Sunspots are dark regions caused by strong magnetic fields that only appear dark because the local magnetic field is so strong that it blocks the upward flow of heat from the sun's interior. For much more information on sunspot activity, see the Sunspots Page. on our sister web site. Top
Solar Flares And CMEs
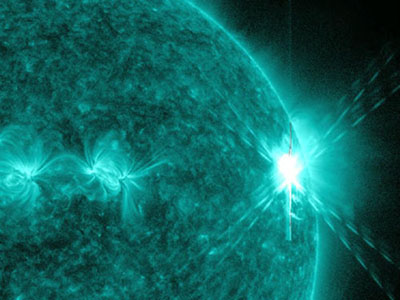
A solar Flare is a very large explosion on the surface of the sun with its plasma suddenly roaring to millions of degrees. Flares occur in the active regions around Sunspots. The Flare shown on the left was an X-class Flare (most powerful) which occurred on August 9, 2011. The image is an extreme ultraviolet picture taken by NASA's SDO satellite. While this Flare produced a Coronal Mass Ejection (CME), the CME was not headed towards the earth and no local effects were observed. The energy emitted from a Flare is about one sixth of the sun's total energy output each second. Strong Flares eject streams of electrons, ions, and atoms (Solar Storms) into outer space.
Flares are formed when intense magnetic fields from below the sun's surface link up with magnetic fields in the outer Corona in a process called "Magnetic Reconnection". Flares are powered by the sudden release of magnetic energy stored in the sun's Corona.
The same energy release may also produce a CME, but not always. And, sometimes CMEs form without Flares. The connection between Flares and CMEs is not well understood.
Magnetic Reconnection is a physical process in highly conductive plasmas where magnetic fields clash, re-configure themselves into a lower energy level, and the excess magnetic energy is then converted into kinetic and thermal energy. Big Flares are equivalent to billions of megatons of TNT exploding within a few seconds. Electrons, protons, and other particles that are accelerated by Magnetic Reconnection in a Flare approach the speed of light. It is still not possible to predict when a CME or Flare will erupt because the trigger mechanism isn't known. (The Northern Lights are an example of magnetic reconnection in the earth's atmosphere.)
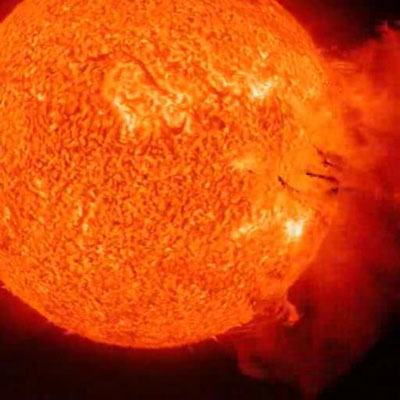
The solar flare at the left from June 7th, 2011 was a medium sized Flare, an M2 on the x-ray scale, but it produced a spectacular CME. Its size was in the top 5% of all CMEs recorded in the "Space Age". The plasma contained blobs that were as big as planets, many larger than the earth.
NASA reported "They rose and fell ballistically, moving under the influence of the sun's gravity like balls tossed in the air, exploding like bombs when they hit the surface."
Flares produce radiation across the electromagnetic spectrum, although with different intensities. Most of their energy goes to frequencies outside of our visual range so the majority of Flares are not visible to the naked eye and must be observed with special instruments. While not very intense at white light, they can be very bright at particular frequencies. Solar Flares are classified as A, B, C, M or X according to the peak flux of X-rays at a specified frequency range.
Each class has a peak flux ten times greater than the preceding one. Within a class there is a linear scale from 1 to 9, so an X2 Flare is twice as powerful as an X1 Flare. Solar Flares strongly influence space weather in the vicinity of the earth. They can produce streams of highly energetic particles (alpha particles) in the Solar Wind.
The biggest solar storm ever recorded was the Carrington Flare of 1859, named after Richard Carrington, a prominent English astronomer who observed it. It was the first Solar Flare ever recorded. Skies erupted in red, green, and purple auroras so brilliant that newspapers could be read in the dark as easily as in daylight. Stunning auroras pulsated as far south as Cuba, El Salvador, and Hawaii. Telegraph systems worldwide went haywire. Spark discharges shocked telegraph operators and set the telegraph paper on fire. The Carrington Flare was the largest Flare in the past 500 years as measured by radiation particles locked in the polar ice. A similar Solar Flare that generates a "massive" CME could knock out current day electrical grid power for months.
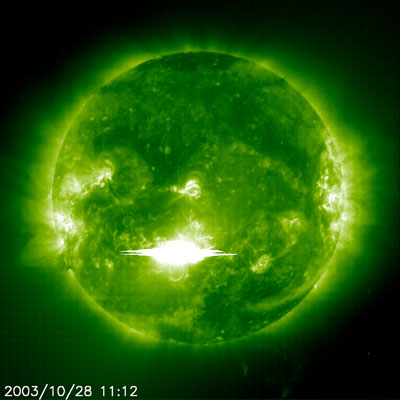
Shown at the left (in green) is a super large Solar Flare from October 2003. Another Solar Flare on January 20, 2005 released the highest concentration of protons ever measured and took only 15 minutes after initial observation to reach earth. This calculates to be a velocity of about one-third the speed of light. Energetic protons can pass through the human body causing biochemical damage and hence they present a hazard to astronauts. The January 20, 2005 "radiation" storm would have given astronauts only 15 minutes to seek shelter.
Most radiation storms take two hours from the time of visual detection to reach earth's orbit. CMEs are clouds of plasma and particles that travel much slower than radiation storms (about 300 miles a second vs. 30,000). We do have satellites far out in space that monitor the sun day and night. NASA is working on programs to detect CME storms and give utilities an early warning of up to 30 minutes. See Forecasting Storms on the Smart Grid Page.
Recently NASA announced that about 1 in 7 Flares experience an aftershock. About ninety minutes after the Flare initially dies down, it springs to life again producing an extra surge of extreme ultraviolet radiation. The energy in the second phase can exceed the energy of the primary phase by as much as a factor of four. The late phase is thought to result from some of the Sunspot’s magnetic loops re-forming.
The extra energy from the late phase can have a big effect on earth. Extreme ultraviolet wavelengths are particularly good at heating and ionizing earth’s upper atmosphere. When our planet’s atmosphere is heated by extreme UV radiation it puffs up, accelerating the decay of low-orbiting satellites.
Furthermore, the ionizing action of extreme UV can bend radio signals and disrupt the normal operation of GPS satellites.
Living with a "restless" star can be difficult at times. Top
Solar Nanoflares
When you see the word "nano", one naturally expects the object to be something small. And sure enough, solar nanoflares are a "billion" times less energetic than ordinary solar flares. But, compared to an explosion here on earth, each nanoflare has the energy equivalent of 10,000 atomic bombs. The sun can go months without producing an ordinary solar flare. Nanoflares, on the other hand, are crackling on the sun non-stop and many go off at the same time.
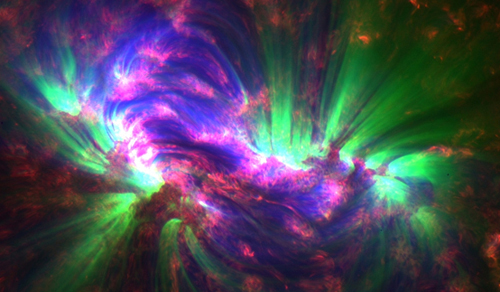
X-rays stream off the sun in the dramatic image to the left taken by NASA's Nuclear Spectroscopic Telescope Array, NuSTAR, overlaid on an ultraviolet image taken by NASA's Solar Dynamics Observatory (SDO). This remarkable image was the first x-ray picture taken by NuSTAR of the sun. (NuSTAR's mission is to take x-ray images of objects in distant outer space, like quasars for example. Pointing NusSTAR at our relatively close sun was using it out of character.)
NuSTAR has just the right combination of sensitivity and resolution to study the x-ray flickers of nanoflares. This image, taken in December, 2014, removed any doubt. NuSTAR turned toward the sun and, working together with NASA's SDO, captured one of the most beautiful images in the history of solar astronomy.
The NuSTAR data, seen in green and blue, reveal solar high-energy emissions (green shows energies between 2 and 3 kilo-electron volts, and blue shows energies between 3 and 5 kilo-electron volts). These high-energy x-rays come from gas heated above 3 million degrees. The red channel represents ultraviolet light captured by SDO and indicates the presence of lower-temperature material at 1 million degrees.
For more than a half-century, scientists have trying to figure out what causes the sun's corona to be so hot. It is one of the most vexing problems in astrophysics. One theory is that nanoflares might be involved. They appear to be active throughout the 11 year solar cycle, which would explain why the corona remains hot during the Solar Minimum. And while each individual nanoflare falls very short of the energy required to heat the sun's corona, collectively they might have no trouble doing to job. Stay tuned. Top
Spicules And Alfvénic Waves
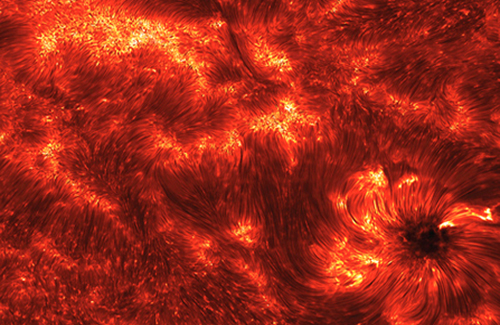
Spicules (spik'-cules) are the dark red images in the picture to the left. They are dynamic jet spouts about 300 miles in diameter shooting up into the Cromosphere from the Photosphere (surface of the sun). An individual Spicule typically reaches up to 30,000 miles above the Photosphere At any one time there are aboout 60,000 to 70,000 active Spicules on the sun's surface. They are found in regions of strong magnetic fields. Spicules live for about 5 to 10 minutes.
NASA compares the Spicules to "seaweed" in the ocean swaying back and forth in the ocean's waves. Only in the sun's Corona, magnetic field ripples called "Alfvénic Waves", cause the the Spicules to sway. A close up view from the Solar Dynamics Observatory (SDO) spacecraft using ultraviolet techology shows the Spicules in the picture in the left below. The different colors represent various gas temperatures.
Alfvénic Waves, named after Hannes Alfvén, are magnetically induced waves in electrically conducting fluids. Conducting fluid examples are salt water, electrolytes, liquid metals, and of course plasmas. Alfvén discovered this phenomenon in 1942 and won the Nobel Prize in Physics for it in 1970.
Alfvén suggested that large plasmas could carry huge electric currents capable of generating "galactic magnetic fields" (i.e. the sun's Magnetic Current Sheet described above). Alfvénic Waves travel up and down a magnetic field line much the way a wave travels up and down a plucked guitar string. NASA's SDO is now able to measure how much energy is carried by the Alfvénic Waves spewing out from the jets of Spicules.
The research shows that the waves carry 100 times more energy than previously thought. While the Alfvénic Waves carry enough energy to drive the intense heating of the Corona to 200 times hotter than the sun's surface and the solar winds up to 1.5 million miles per hour, how much of this energy is actually transferred is unknown.
The Alfvénic Waves as we know them today could account for the energy of the Corona and Solar Wind, but there is not enough energy to account for the huge mass of plasma materials ejected during CMEs. Says Scott McIntosh at the National Center for Atmospheric Research (NCAR) in Boulder, Colorado, "We still don't perfectly understand the process going on, but we're getting better and better observations. The next step is for people to improve the theories and models to really capture the essence of the physics that's happening. Now that the real power of the waves has been revealed in the Corona, the next step in unraveling the mystery of its extreme heat is to study how the waves transfer their energy to the plasma." Top
The Heliosphere
Helios in Greek means the "sun". Hence Heliosphere means the "sphere of the sun". The Heliosphere is a comet-like shaped bubble with a trailing tail filled with hydrogen and helium gases from the Solar Wind. The Solar Wind is a constant stream of charged particles emanating from the sun's extremely hot outer Corona atmosphere, which is 4,000 K at the surface, but 20,000,000 K at the outermost hottest points! We do not have a theory at this time to explain these extreme temperatures.
The concept of a "flow of charged particles from the sun" surfaced in the scientific literature during the 1940's and 50's, but it was controversial. It was not until 1962 when the Mariner II spacecraft detected a continuous flowing particle wind that the issue was put to bed. The Mariner also discovered that the Solar Wind fluctuated in intensity in a 27 day cycle which was in concert with the rotation of the sun. The Solar Wind particles (ions of hydrogen and helium) can escape the sun's gravity because of their high energy.
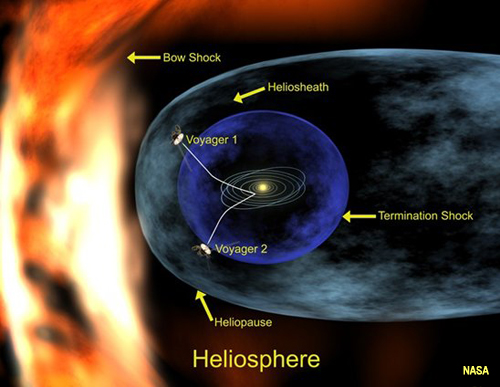
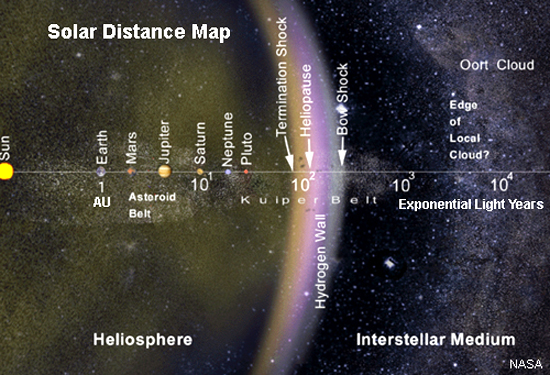
For the first six billion miles from the sun, the Solar Wind travels about a million miles per hour. Even at a million miles per hour, it takes the Solar Wind about a year to reach the outer limits of the Heliosphere. As it begins to come in contact with the Interstellar Wind, it slows down and finally comes to a stop. The point where the wind slows down to subsonic speed (below the speed of sound) is called the Termination Shock, which is about 90 AU (Astronomical Units) from the sun. The edge of our solar system is called the Heliopause which is where the Solar Wind and the Interstellar Wind pressures balance. The area between the Termination Shock and the Heliopause is called the Heliosheath and is extremely large, about 100 AU in the front and includes the long tail in the rear. The area where the Interstellar Wind coming from outer space meets the Solar Wind is called the Bow Shock. The Bow Shock is so named because it is similar to the water wave in front of a ship's bow, except in this case it is a gaseous wave. See the NASA Illustration Video of the Heliosphere.
In 1977 Voyagers 1 and 2 were launched and headed out into space at 39,000 and 35,000 miles per hour respectively. After completing their planetary missions, they continued towards outer space in somewhat opposite directions, but still had enough power to continue to communicate back to earth. In December of 2004 Voyager I passed the Termination Shock (TS) at 94 AU and Voyager 2 passed the TS in August of 2007 at 84 AU. The voyagers are now (July, 2011, 34 years later) proceeding through the Heliosheath and are getting close to the Heliopause, the edge of the Heliosphere the outer boundary of our solar system.
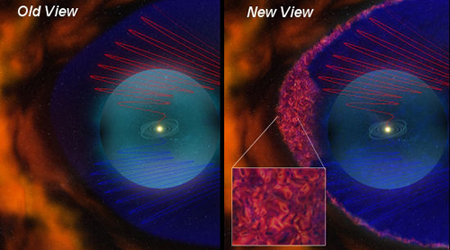
In June of 2011 NASA surprised everyone when they announced that the Voyagers were encountering huge frothy magnetic bubbles at the Heliosphere boundary. See the diagram at the left. (The red and blue wavy lines represent the sun's magnetic waves.) This was totally unexpected. Some of the bubbles are 100 million miles wide. NASA explains: "Because the sun spins, its magnetic field becomes twisted and wrinkled, a bit like a ballerina's skirt. Far, far away from the sun, where the Voyagers are now, the folds of the skirt bunch up. The crowded folds of the skirt reorganize themselves, sometimes explosively, into foamy magnetic bubbles. The actual bubbles appear to be self-contained and substantially disconnected from the broader solar magnetic field." This is all recent news and scientists are still studying this bubble phenomenon. See a 3 minute NASA video on Youtube regarding the Magnetic Bubbles.
The speed and magnetic strength of the Solar Wind varies in step with the Sunspot Cycles. During the sun's quiet periods like the one ending in 2008, the speed of the Solar Wind slowed considerably. The Ulysses spacecraft measured the decrease in speed to be as much as 20% during the last solar minimum compared to the previous solar minimum. These variations do affect our weather here on earth. The last "little ice age" corresponds in time to the "Maunder Minimum" period in the Sunspot Cycles. Most scientists believe that these variations also affect the size of the Heliosphere - i.e. the Heliosphere expands and contracts in synch with the Sunspot Cycles. However, at the moment this is just theory. Perhaps the Voyagers will shed some light on this phenomenon. Top
Star Mira - Example Of An "Astrosphere"
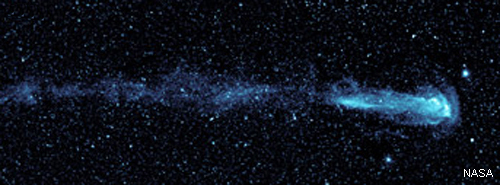
NASA has observed a real comet-like sphere similar to our Heliosphere from the star Mira (pronounced My-rah) 350 light years away in the constellation Cetus. These spheres are now called "astrospheres". Mira has a comet-like shield and glowing tail similar to our sun as shown in the picture to the left. The tail contains carbon, oxygen and other matter capable of eventually forming new planets. The Bow Shock can be clearly seen in front of the star. Mira is a highly evolved star traveling at 290,000 miles an hour. It is a " red giant" - bloated as if our sun stretched all the way to Mars. These are signs of a star
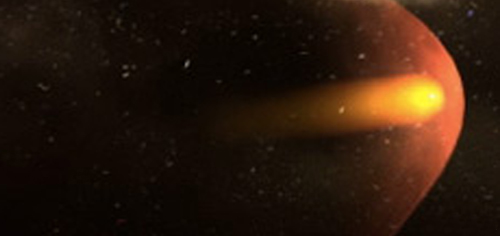
approaching its end of life. As the hydrogen gas in its surrounding sphere cools and loses energy, it gives off ultraviolet light which the NASA space telescopeGalaxy Evolution Explorer was able to photograph in 2006. Mira's comet-like tail stretches an amazing 13 light years across the sky. For comparison sake, the nearest star to our sun is Proxima Centauri four light years away. See the Mira Video. To the left is an artist's conception, from the Adler Planetarium in Chicago, of what our sun and Heliosphere look like sailing through space. Since our sun is still young, the Bow Shock is believed to be much more visible than the one for Mira. Also, since the sun is not dying and throwing off lots of materials, the tail should be much shorter. Top
Cosmic Ray Shield
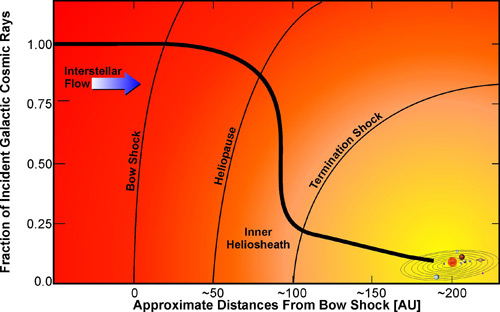
The chart on the left, also from the Adler Planetarium in Chicago, depicts the flow of very "high energy cosmic rays" (greater than 100 million electron volts, 100 MeV) that flow from outer space. Cosmic rays consist of 90% hydrogen protons, 9% alpha paticles (two protons, two neutrons) and 1% other. The very red area represents 100% of the flow as it hits the Bow Shock, the outermost region of our Heliosphere. About 20% of the cosmic rays do not make it to the Heliopause. However, from the Heliopause to the Termination Shock, about 60% of the rays are neutralized by our sun's Solar Wind. Once inside the Termination Shock, another 10% are absorbed by the Solar Wind. Finally, about 10% of the cosmic rays make it into our Solar System, depicted by the color yellow in the chart. The rays that make it through the above are almost all blocked by the earth's magnetic field and the ozone layer of the atmosphere. This drop off process is depicted on the chart by the thick black line and the scale to the left. The Heliosphere provides a vital shield for life here on earth. Without it, we would be exposed to these deadly cosmic rays from the Interstellar Wind. Top
How Long Will The Sun Last?
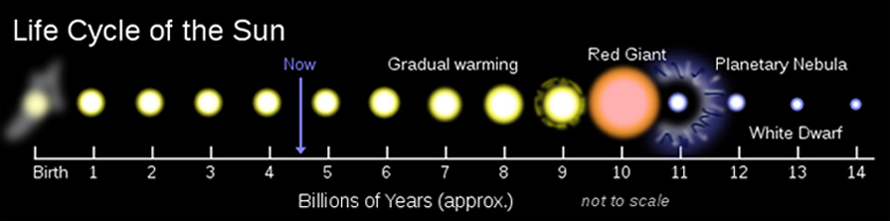
The sun is estimated by two different methodologies to be 4.6 billion years old. The sun will last about 10 billion years as a "main sequence" star. Main sequence means that by nuclear fusion it converts hydrogen into helium plus some neutrinos and radiation. The sun does not have enough mass to explode like a "super-nova". In about 5 billion years the sun will enter a "red giant" phase. As the hydrogen in the core is consumed, the core will begin to contract and heat up. "Helium fusion" will then begin and the sun's outer layers will expand significantly. Following the red giant phase the sun will eject its outer layers forming a "planetary nebula", which is a large glowing shell of ionized gases. After all the outer layers have been ejected, that which remains will be the extremely hot "white core". The white core will slowly cool and fade away as a "white dwarf" over many billions of years. This is the typical end of a medium sized star. Top
The Big Questions
Corona Heating
The sun's outer atmosphere, the Corona, is extremely hot (millions of degrees K) at its outer edges while the Photosphere (the visible surface of the sun) has a temperature of only 5,800 K. The processes that super heat the Corona, maintain it at extreme temperatures, and accelerate the Solar Wind are a still somewhat of a mystery. Usually temperatures decrease as you move away from a heat source. This is true in the sun's Core right up to the surface. Then over a relatively small distance, the temperatures suddenly rise to extreme highs - 20 million degrees K! While recent data show that Spicules expel enough energy to do the heating (see Spicules section above) how they transfer their heat to the Corona and how much heat is transferred is still unknown.
Nature Of Solar Flares And CMEs
Areas on the sun near Sunspots often flare up heating the plasma to millions of degrees in just seconds and blasting billions of tons of plasma material into space. The precise causes of Solar Flares and Coronal Mass Ejections (CMEs) are solar mysteries. We do know that Spicules do not have enough energy to expel CMEs. We think we understand the basic magnetic mechanisms. However, many pieces of the puzzle are missing. We can not reliably predict when and where a flare will occur or how big it will be.
Origin Of Sunspot Cycles
Over an approximate 11 year period, the monthly daily average number of Sunspots observed on the sun's surface increases from nearly zero to over 100 and then decreases to near zero again as the next cycle starts. The nature and under pinnings of the Sunspot Cycle constitute some of the great mysteries of solar astronomy. While we know many details about Sunspot Cycles and also about some of the processes that play a role in producing them, we are still unable to produce a scientific model that explains Sunspot occurrences using basic physics principles. For much more information on sunspot activity, see the Sunspots Page. on our sister web site.
For a good source of information about the sun, see the NASA Sun-Earth Web Site.