Earth's Magnetic Field
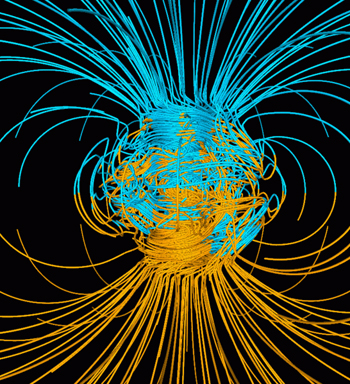
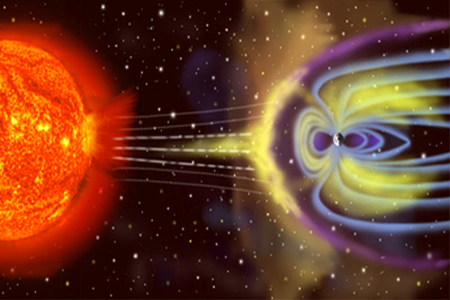
At the left is a computer simulation of the earth's Magnetic Field. The colored lines represent magnetic field lines, blue lines indicate that the the magnetic field points towards the earth's center and yellow lines indicate that the field points away. The rotational axis of the earth is centered and is vertical. The dense clusters of lines in the center are within the earth's core.
The earth's Magnetic Field is similar to the field that would be created if a hypothetical bar magnet were placed at the center of the earth. However, unlike the field of a bar magnet, the earth's Magnetic Field changes over time because it is generated by the motion of molten iron alloys in the earth's "Outer Core". See the sketch below at the left.
The solid "Inner Core" of the earth is surrounded by a fluid mixture of molten iron and nickel forming the "Outer Core". The magnetic field of the earth is caused by currents of electricity that flow in the molten Outer Core. These currents are hundreds of miles wide and flow thousands of miles per hour as the earth rotates. The resultant powerful magnetic field passes through the crust and enters outer space.
If the earth rotated faster, it would have a stronger magnetic field. If it had a larger liquid core it would also have a stronger magnetic field. By the time the field has reached the surface of earth, it has weakened quite a bit, but it is still strong enough to keep a compass needle pointed towards the north pole. The earth has the strongest magnetic field of all the rocky planets.
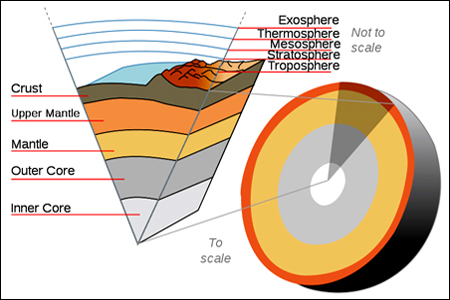
The magnetic poles of the earth are not fixed on a given spot, but wander quite a bit. The pole in the northern hemisphere is moving northwards in latitude about 6 miles per year, but this is just an average. On any given day, the pole moves erratically by up to a tenth of a mile caused by changes in the currents inside the earth's core as well as the effects of Magnetic Fields in the Ionosphere. The Ionosphere includes three sections of the upper atmosphere: the Mesosphere, the Thermosphere and the Exosphere. Click here for more information on the earth's atmosphere. The Ionosphere is unique because it is "ionized" by solar radiation. The earth's Ionosphere is sustained by electromagnetic forces that are much stronger than gravity. The Ionosphere also forms the inner edge of the earth's Magnetosphere.
The magnetic field of the earth actually reverses its polarity over time. These changes are called Polarity Reversals. The last Polarity Reversal happened about 770,000 years ago. At the present time, earth's Magnetic Field is weakening in strength by about 5% every 100 years. It may be near zero in another few thousand years at the current rate. Scientists have a lot to learn about the exact behavior of earth's complex Magnetic Field. Making predictions about what it may look like in a few thousands years from now is a matter of guessing, not forecasting. Top
Earth's Magnetosphere
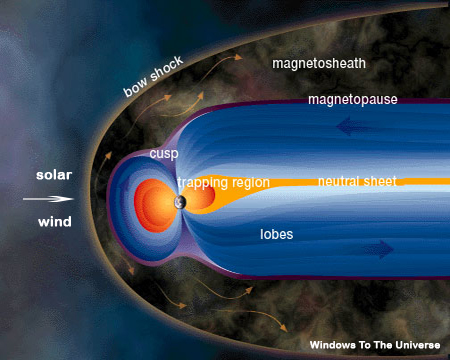
The sun isn't the only celestial body with a comet-like sphere around it. The earth also has a comet-like sphere around it. However the earth's sphere, the Magnetosphere (magnet-o-sphere) is significantly different than the sun's Heliosphere. Although magnetically driven, the sun's sphere consists of charged particles which are part of the Solar Wind. The earth's Magnetosphere, on the other hand, consists of a Magnetic Field generated by the the earth's interior metallic core. The Magnetosphere is the region surrounding the earth where the earth's Magnetic Field dominates the Solar Wind.
A magnetosphere anywhere is formed when a stream of charged particles in the solar wind is deflected by the strong magnetic field of a planet. The shape of the earth's Magnetosphere is the result of a rotating moving body (the earth and its sphere) confronting the flow of the solar wind. (Think of a ship traveling up the Mississippi River.) Similar to the Heliosphere, the edge of the Magnetosphere is called the Magnetopause and the point where the Magnetosphere meets the Solar Wind is called the Bow Shock. The area between the Bow Shock and the Magnetopause is called the Magnetosheath.
The Magnetosphere prevents most of the charged particles carried by the Solar Wind from hitting the earth. The earth's Magnetosphere was discovered in 1958 by Explorer 1. However, scientists previously knew that electric currents existed in outer space because solar CMEs sometimes led to "magnetic earth storms". Life on earth developed and is sustained under the protection of the Magnetosphere. Mars, with almost no magnetic field, is believed to have lost most of its oceans and atmosphere to outer space due to the Solar Wind. Top
Solar CMEs
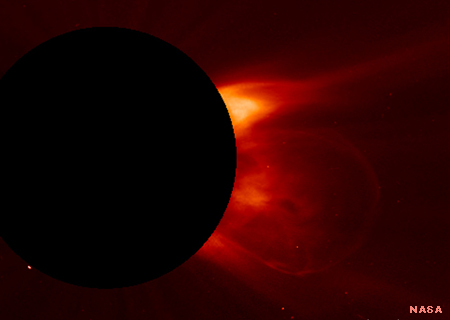
Solar Prominences rise up through the Chromosphere from the Photosphere sometimes reaching altitudes of 100,000 miles. A Prominence is a mass of plasma gases and charged particles that are cooler (60,000 degrees C) than the surrounding Chromosphere (a million degrees plus C). The mass of a Prominence is typically about 100 billion tons. Some Prominences break apart from the sun and morph into Coronal Mass Ejections (CMEs). Scientists believe that Prominences and CMEs are caused by intense magnetic activity beneath the surface of the Photosphere.
At this time we do not have a theory of exactly how Prominences and CMEs are formed. The gigantic CME at the left was photographed in March, 2008. Note that the CME size is about a quarter of the circumference of the sun! If you look carefully in the lower right, you can see a faint circle in front of the CME. That is the "bow shock" of the CME, a feature rarely seen as the CME has to be perpendicular to the camera in order to see it.
Most CMEs just fly off into outer space. However, CMEs expand like a megaphone as they travel outward from the sun. A small number have the right shape, position and speed to intercept the earth in its orbit around the sun. A CME takes one to three days to reach the earth depending on its individual speed. A CME that intercepts our orbit will clash with the earth's Magnetosphere and is called a "Solar Storm". Our Magnetosphere does a good job of protecting us from the Solar Wind and Solar Storms. Top
Solar Storms
When the magnetic field of a CME interacts with earth's magnetic field, there is a induced magnetic reaction here on earth. If the CME is a mild one, as most are, we see the reaction as a strong aurora in the sky near the north pole which we would term an extended "northern lights" show. However, during severe Solar Storms, enormous amounts of energy are transferred to our Magnetosphere which can create huge "Geo-magnetically Induced Currents" (GICs) running through the earth's surface and through the grid. Under certain conditions, these massive currents can melt giant grid transformers. This actually happened in 1989 and 2003 damaging transformers in New Jersey, Canada, and Great Britain.
Although these Solar Storms did some local damage, relatively speaking the damage was not widespread. In addition to grid transformers, satellites are also subject to Solar Storms. There are over 900 operating satellites in space and they are all vulnerable to Solar Storms, especially communications satellites. Digital electronics in space have to be "radiation hardened", i.e. shielded by design from Cosmic Rays, Allen Belt Radiation and Solar Storms. About once every 500 years, a humongous solar storm can hit the earth. One such storm hit in 1859, shocking telegraph operators and setting their offices on fire. If such a disastrous storm should hit today, experts tell us that the damage could be devastating. For more information on solar storms see the Solar Storm Page. Top
Sunspot Cycles
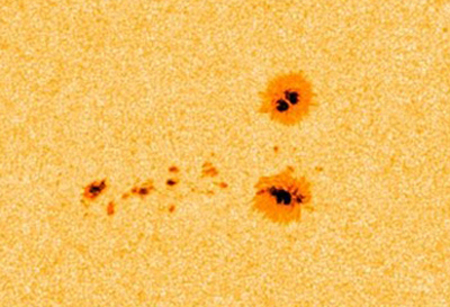
Daily Sunspot counts have been recorded since observations by Galileo in the early 1600's. A sunspot example is shown at the left. However it was about 150 years later that Samuel Schwabe, after 17 years of observations, noticed the cyclical pattern in the Sunspots and that the Sunspot Cycle length was approximately 11 years. In the modern age, a large number of counts from all over the world are reported each day and they are averaged.
When looking at Sunspot counts over hundreds of years of data, the daily counts are usually averaged into a monthly number to keep the graphs manageable. In summary, the monthly daily average number of Sunspots increases from almost zero to over 100 and then decreases to near zero as the next cycle begins. In 1919 George Hale demonstrated that the Sunspot Cycles coincided with the sun's magnetic cycles. However the magnetic cycle was a 22 year cycle, double the 11 year Sunspot Cycle. It is now believed that "twisting magnetic action" in the sun's plasma Convection Zone just beneath the surface causes Sunspots to form. For more Sunspot information, see the Sunspots Cycle Page
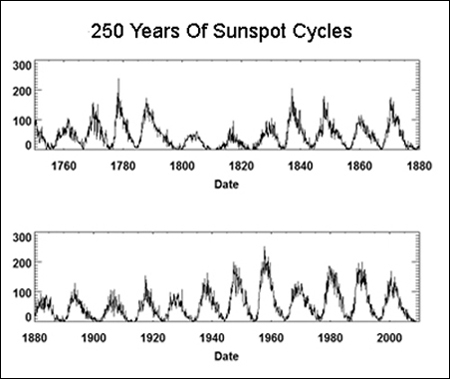
The solar sunspot cycles have been accurately measured for the past 250 years (and even before that). See chart at left. Starting in 1755 the cycles have been numbered so that they can be easily referred to. One of the great Sunspot mysteries is the Maunder Minimum which lasted 70 years starting about 1650. Sunspots were rarely observed during this period but this was not for the lack of attention. Accurate records were kept, even though the cyclical nature was not yet known.
Most researchers are convinced that the Maunder Minimum was the cause of the Little Ice Age that occurred on earth at the same time. This is direct evidence that the sun's variations have a significant influence on the earth's climate. See more on the Maunder Minimum.
For reasons not understand, the cycles revived themselves around 1750 and have continued in their 10.7 average yearly period ever since. The earth has been continuously warming ever since 1850. We are now in sunspot cycle 24. Cycle 23 ended in December of 2008 and it was a long cycle lasting 12.6 years.
Sunspots are in general a good measure of the sun's internal activity. When the sun is active the surface has many Sunspots, Flares, Prominences, and Coronal Mass Ejections (CMEs). Sunspots themselves have no influence on our climate. However, they are an indicator of significant magnetic activity beneath the surface of the Photosphere that does have climate influence. Top
Global Warming
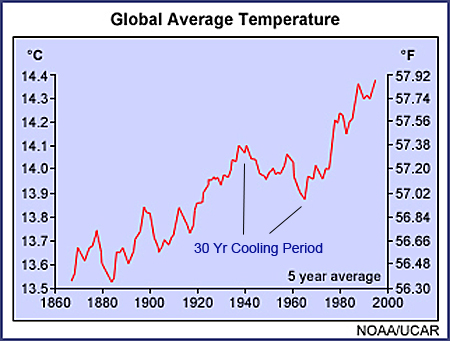
As shown in the NOAA (National Oceanic and Atmospheric Administration) chart at the left, the temperature rise from 1890 to 2010 has been about 0.9°C (or 1.6°F). Just about everyone agrees that in our last 100 years our global temperatures have risen a modest amount - 0.3% - as measured scientifically using a Kelvin scale of 286.5 (56.3°F) to 287.3 (57.7°F). So global warming is very real, but very modest.
The question then becomes "is the cause of global warming a natural one caused by the sun, orbit of the earth, other natural causes or is it man made by the burning of fossil fuels, etc. Note that from 1940 to 1970, a 30 year timeframe, there was a mini cooling period, but then the heating trend resumed.
As mentioned above, the last Sunspot Cycle (number 23) was 12.6 years, a very long cycle. And, Cycle Number 24, which started in January, 2008, is well underway and also appears to be a very weak cycle. Both of these items indicate that the earth is entering an extended cooling period as far as heating from the sun is concerned. However, there is normally a several year lag before the cooling period is felt because of the mass of the oceans and their heat retention ability.
A paper byJasper Kirby, a British CERN scientist, defines the sun's mechanisms that contribute to climate change:
- Strong Sunspot Cycles indicate a very active sun and a strong Solar Wind.
- A strong Solar Wind decreases the amount of outer cosmic rays that enter the earth's Magnetosphere by increasing the number of particle collisions in outer space.
- Cosmic rays induce cloud formation. Fewer cosmic rays result in less heavy cloud cover.
- Less heavy cloud cover allows more sunlight to descend on the earth which increases the earth's warming.
Also note that the earth's climate can be temporarily affected for a few years (cooled) by the release of large amounts of debris into the atmosphere from violent volcanoes. However, this has not been the case recently. Top
Was Climate Warming In A Stall?
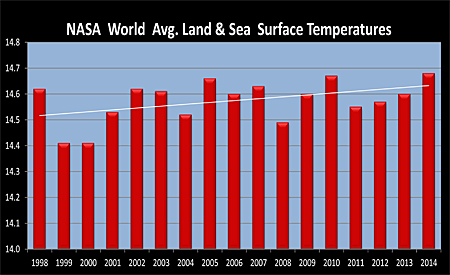
The chart at the left was created from data released in January, 2015 by NASA at the Goddard Institute for Space Studies (GISS). The averages in degrees C were calculated based on readings from a huge number of surface measuring stations both on land and sea from around the world. While the chart shows some fluctuations, note the scale. The data low point is 14.41°C and the high point is 14.68°C. This is a maximum fluctuation of 0.27°C, only about one half a degree Fahrenheit over 17 years. If this chart were to be constructed using a more typical temperature scale, it would appear very flat.
The white average trend line shows a difference of 0.11 degrees C or 0.20 degrees F between 1998 and 2014. There has been a slight increase in the average world temperature since 1998. If this rate of change were to be extrapolated to 100 years, the increase would be 1.2 degrees F over 100 years. This compares to an increase of 1.1 degrees F from 1900 to 2000 - a hundred years. Based on this data, climate warming continues to increase at a steady rate.
A September 2015 Stanford study refutes a widely accepted view that during the period between 1998 and 2013 there was a pause in the recent rate of global warming. An apparent lull, that has been widely accepted as fact, is actually an artifact rising from faulty statistical methods, an interdisciplinary team of Stanford scientists said. Using a novel statistical framework that was developed specifically for studying geophysical processes such as global temperature fluctuations, the team of Stanford collaborators showed that a hiatus never happened. The team found that the rate of increase of global surface temperatures did not stall or slow down from 1998 to 2013 in a statistically significant manner. In fact, the rate of change in global surface temperature was not statistically distinguishable between the recent period and other periods earlier in historical data. Top
Carbon Dioxide Effect
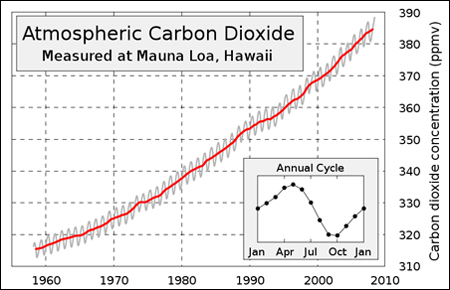
Most of the scientific climate community attribute the recent warming to an increase in greenhouse gases and in particular carbon dioxide - CO2. Carbon dioxide accounted for 387 parts per million (ppm) of the earth's atmosphere in 2009, having increased from 284 ppm in the 1830's (the beginning of the industrial revolution). See the chart at the left from Mauna Loa, Hawaii showing the yearly increases in CO2. One can see that there is an annual cycle to the CO2 Chart. In the spring and summer plants consume CO2 (total CO2 decreases) while in the fall and winter plants are quiet and humans increase CO2 more each year.
The IPCC has stated that: "Greenhouse gases, largely the result of human activities, has very likely caused most of the observed global warming over the last 50 years". There is no question that the amount of CO2 in the atmosphere is increasing. The question is whether or not the increase of CO2 is causing the warming trend, or vice versa, is the warming trend causing the CO2 to increase.
Only a very small portion of our atmosphere is CO2 - 0.039% (4/100 of 1%). Does the increase of 0.01% really make a difference in the climate? A majority of climate scientists the world over think the answer to that question is "yes". See The Greenhouse Effect. Because the proportion of greenhouse gases in the atmosphere is so very low, human greenhouse gas emissions can have a significant effect. The burning of fossil fuel for transportation, electricity, etc. and the destruction of our rain forests have increased the amount of CO2 in the atmosphere say proponents. Climate scientists have produced dynamic models of the atmosphere and these models predict that the continuing increase of CO2 will cause accelerated warming of the planet.
However, there is a piece of information that is somewhat disturbing to the CO2 cause and effect argument by climate scientists. If one looks at the NOAA chart above, one can see that from 1940 to 1970 there was a distinct mini cooling period in spite of the fact that CO2 was rising steadily during this time. CO2 climate skeptics use this period as evidence that CO2 may not be the primary driver of global warming as it does not correlate at all with the cooling temperatures during this 30 year period.
The next decade is going to be an interesting one from a climate point of view. Sunspot activity is known to be down, which should trigger at least a mini cooling period if the sun is the root cause of climate changes. On the other hand, if the CO2 increase (human caused or otherwise) is the root agent, then we should see a continuing trend of higher temperatures. A third outcome is that these two effects could just cancel each other out and we could go sideways as seems to be the case with temperatures staying in a relatively narrow range per the CRU data above.
British climate scientist James Annan (CO2 warming proponent) has a $10,000 US bet with two Russian physicists, Galina Mashnich and Vladimir Bashkirtsev (solar cooling proponents), that the average global temperature during the five year period 2012-2017 will be higher than that during the 1998-2003 period. Only time will tell who is more right. Top
Is Global Warming Bad?

Balanced View. We are striving to present a balanced view of Climate Change. Historically we are in a long term warming trend, there is no debate about that. The real question is whether or not it is man-made and accelerating. Whichever turns out to be true, we will still have to deal with a warmer climate. Lets examine the consequences of a warmer climate.
Warming Continues. For the sake of argument, let us assume that "global warming" continues at a modest pace such that by the year 2100 the average world temperature is 1 to 2°C (2 to 4°F) warmer. What will be the realistic affect on the planet?
Polar Bears. Polar bears were most likely in some version of their present form during the last interglacial (warming) age about 120,000 years ago when there was virtually no ice at the North Pole and the average Arctic temperatures at that time were 3 to 5°C (5.7 to 9.5°F) higher than present. Somehow the polar bears survived. In any case, the polar bear population needs to be studied with respect to their adaptability and management systems put in place to guarantee their survival.
Warming Is Better Than Cooling. The earth's long term climate is always changing, warming and then cooling. It is never steady for very long. Most professional scientists agree that if we have a choice, warmer climates are better than cooler ones.
So here are some items to think about:
All things being equal, whether it is a fish in the ocean, a shrimp in an pond, or a bean on a vine, it will grow faster when it is warmer rather than colder.
-
CO2 is not a pollutant but is the primary food of plants that feed animals and us. More crops are grown when it is warmer than when it is cooler. During the mini cooling period of the 1970's, agricultural experts worried about world-wide food shortages.
-
Measured rain precipitation rates increase between 5% and 10% for every degree C climate increase. (The expected rate of increase just based on thermodynamics is 7%.) The atmosphere definitely holds more moisture as temperatures increase, so overall there will be more rainfall. But, warmer temperatures also mean that ground evaporation is faster. Therefore, the increase in rain precipitation is not expected to be uniform - some areas will receive more rain and some may become drier. The outcome for any individual area will depend upon its local weather patterns.
-
If the warming trend conforms with the previous Vostok peaks, i.e. a 2°C rise, complete melting of the Greenland Ice Sheet would take 50,000 years. If in the long run global warming reached 8°C (6°C above the Vostok peaks), the complete melting of the Greenland Ice Sheet would take 2,000 years according to the latest models.
- A warmer climate would reduce the occurrence of cold temperature related illnesses, such as colds and flu. The likelihood of massive flu-like epidemics would be reduced.
After the unusual hurricane season of 2005 (Katrina, etc.), alarmists blamed climate warming for the disasters. The latest statement from the UN World Meteorological Organization (parent organization of IPCC) concluded that "no individual tropical hurricane can be directly attributed to climate change".
-
When one part of the globe is warmer than usual, say the US in in the winter of 2011-2012, other parts of the world are undergoing extreme cold, i.e. Europe and Russia in 2011-2012. That is why it is necessary to use carefully computed world average temperatures when drawing conclusions about climate change.
-
Humans will be quick to take advantage of a warmer climate in general and adjust accordingly as required in certain areas.
Summary. While it is not clear what the short term climate outlook will be, it seems likely that in the long term we will continue in the now centuries old modest warming trend. The negative effects of global warming have been grossly exaggerated by politicians, aggressive climatologists, and the media. The advantages of a warmer climate have been completely ignored and usually never mentioned. If the warming cycle is accelerating, we will just have to deal with it within reasonable limitations.
We should continue to reduce greenhouse gases, and in particular carbon dioxide and other soot particles for many reasons including warming, health, sourcing of energy, and political stability. If we exert reasonable control over fossil fuel emissions, we will be able to live with the impacts from global warming.