Types Of Solar Storms
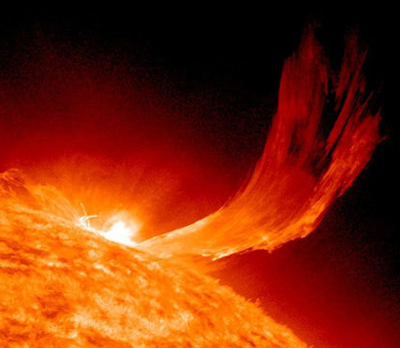
A Solar Flare is a very large explosion on the surface of the sun causing its plasma to suddenly roar to millions of degrees. Flares occur in the sun's active regions around Sunspots. The enormous energy emitted during a Flare is about one sixth of the sun's total energy output each second. Strong Flares eject streams of electrons, ions, and atoms into outer space. When they encounter the earth's atmosphere we call them Geo-Magnetic or Solar Storms, which come in three distinct stages (but not all Flares get to stage three):
-
First high energy electromagnetic rays - gamma rays, x-rays and ultraviolet rays - ionize the earth's upper atmosphere, interfering with radio communications and GPS systems. Stage one, traveling at the speed of light, takes about eight minutes to reach the earth's atmosphere.
-
Second comes a proton storm, potentially dangerous to unprotected astronauts. Stage two takes from 23 minutes to two hours or more to reach earth, traveling up to one-third the speed of light. Our Magnetosphere protects us from proton storms.
-
Third comes a coronal mass ejection (CME), a slower moving cloud of charged particles that can take two to three days to reach earth. CMEs can react violently with the earth's Magnetosphere and cause extensive grid damage. Top
Solar Flares And CMEs
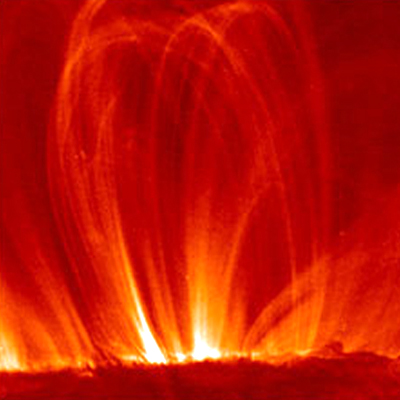
Flares are formed when intense magnetic fields from below the sun's surface link up with magnetic fields in the outer Corona in a process called "Magnetic Reconnection". Flares are powered by the sudden release of magnetic energy stored in the sun's Corona. The same energy release may also produce a CME, but not always. And, sometimes CMEs form without Flares. The connection between Flares and CMEs is not well understood.
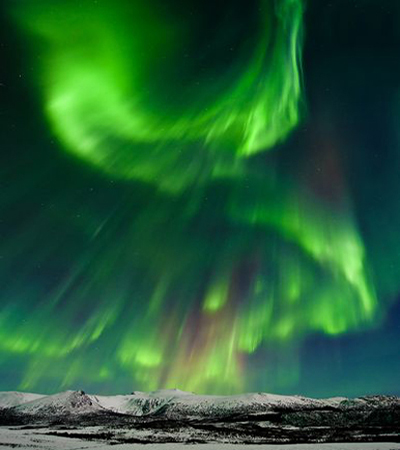
Magnetic Reconnection is a physical process in highly conductive plasmas where magnetic fields clash, re-configure themselves into a lower energy level, and the excess magnetic energy is then converted into kinetic and thermal energy. Big Flares are equivalent to billions of megatons of TNT exploding within a few seconds. Electrons, protons, and other particles that are accelerated by Magnetic Reconnection in a Flare approach the speed of light. It is still not possible to predict when a CME or Flare will erupt because the trigger mechanism isn't known. (The Northern Lights are an example of magnetic reconnection in the earth's atmosphere.)
Flares produce radiation across the electromagnetic spectrum, although with different intensities. Most of their energy goes to frequencies outside of our visual range so the majority of Flares are not visible to the naked eye and must be observed with special instruments. While not very intense at white light, they can be very bright at particular frequencies. Solar Flares are classified as A, B, C, M or X according to the peak flux of X-rays at a specified frequency range. Each class has a peak flux ten times greater than the preceding one. Within a class there is a linear scale from 1 to 9, so an X2 Flare is twice as powerful as an X1 Flare. Solar Flares strongly influence space weather in the vicinity of the earth. Top
Geo-Magnetic Storms
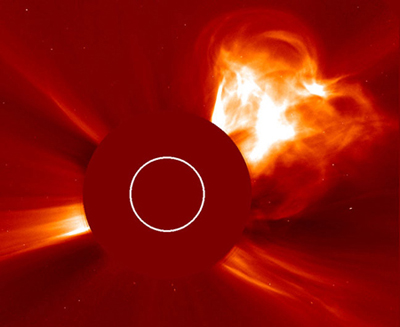
At the left is a large CME shown on a "coronagraph" image - a sun photo with the main part of the sun blocked out so that the sun's Corona is more visible. Large CMEs such as this one, cause Solar Storms in the earth's atmosphere when the path of the CME intersects the earth in its orbit around the sun.
Just like waving a strong magnet over a piece of wire induces a current in the wire, when the strong magnetic field of a large CME interacts with earth's Magnetic Field, there is an induced electric current in the earth's surface. If the CME is a mild one, we see the reaction as a strong aurora in the skies in the northern latitudes which we would term an extended "northern lights" show.
See the Valentine's Day Aurora from 2-14-2011 below. Solar storms affect areas outward from the North Pole because at the North Pole the earth's Magnetic Field lines are pointed in towards the Pole. See the Earth's Magnetic Field and Magnetosphere sections.
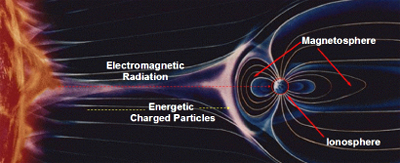
The earth has a comet-like sphere around it called the Magnetosphere (magnet-o-sphere). See the illustration at the lower left. The Magnetosphere is supported by the magnetic field generated by the swirling movements of the earth's inner "fluid metallic" core.
Inside the Magnetosphere, the earth's magnetic field "dominates" the sun's Solar Wind. The shape of the earth's Magnetosphere is the result of a rotating body, the earth and its magnetic sphere, confronting the flow of the Solar Wind, similar to a ship traveling up the Mississippi River.
The Magnetosphere prevents most of the dangerous charged particles, mostly electrons and protons, propelled by the Solar Wind from hitting the earth. The Magnetosphere also does a good job of protecting us from most Geo-Magnetic Storms.
However, during a severe Geo-Magnetic Storm, enormous amounts of energy are transferred from a CME to Electrojet Currents by Magnetic Re-connection. Electrojets are currents flowing in the Ionosphere which when engulfed by a CME create rapid changes in the earth's magnetic field. The rapidly changing magnetic field induces a voltage at the earth's surface which creates huge Geo-Magnetically Induced Currents (GICs) running through the earth's upper crust. These GIC currents venture up into the grid through "ground" connections. The grid acts like a giant antenna attracting GICs. GICs also run through pipelines and railroad tracks.
Areas where the earth has large underground rock formations are more vulnerable to large GICs because the GIC currents are forced to travel closer to the surface. Geological rock formations includes most of North America. Since most Geo-Magnetic Storms are in the northern latitudes, Canada is a prime target. GICs appear as a low frequency AC waveform with a long period (up to several minutes) which, for all intents, appears as a DC current to 60 or 50 cycle AC grid systems. Under certain conditions, massive currents can melt giant grid transformers.
Satellites are also subject to Geo-Magnetic Storms. There are over 900 operating satellites in space and they are all vulnerable to Solar Storms, especially communications satellites. Geo-Magnetic Storms heat the earth's upper atmosphere causing it to expand. The heated air rises and the "air density" at the orbit of satellites (up to about 1,000 km or 620 miles) increases significantly. This results in increased "drag" on satellites in space, causing them to slow and lower their orbit slightly. Unless low-earth-orbit satellites are routinely boosted to higher orbits, they will slowly fall and eventually burn up in the earth's atmosphere. Also, digital electronics used in spacecraft and satellites have to be "radiation hardened", i.e. shielded by design from Cosmic Rays, Allen Belt Radiation and Solar Storms. Top
Significant Past Solar Storms
The 1859 Carrington Event
The largest solar storm ever recorded was the Carrington Event of September 1, 1859, named after Richard Carrington, a prominent English astronomer who observed it. It was the first Solar Flare ever recorded. Skies erupted in red, green, and purple auroras so brilliant that newspapers could be read in the dark as easily as in daylight. Stunning auroras pulsated as far south as Cuba, El Salvador, and Hawaii. Telegraph systems worldwide went haywire. Spark discharges shocked telegraph operators and set the telegraph paper on fire. Telegraph machines operated for hours after the local electricity was shut off. The Carrington Event was the largest storm in the past 500 years as measured by radiation particles locked in the polar ice. If such a disastrous storm should hit today, experts tell us that the damage could be devastating - the equivalent of 20 times Katrina. Parts of the grid and some consumer electricity could be shut down for months.
The 1921 Solar Storm
Over ninety years ago, the highest magnitude storm of the century occurred on May 14th and 15th, 1921. The storm disabled all telegraph service from the Atlantic coast to the Mississippi River and in major portions of the western U.S. The New York Times reported that submarine cables would need to be brought to the surface for repairs. The 1921 storm may have been much stronger than the 1989 storm that collapsed the total Quebec, Canada electrical system. However, sophisticated monitoring equipment, widely deployed today, was not available at the time of the 1921 storm, making exact replication of the storm signals impossible.
The 1989 Solar Storm
The NERC (North-American Electric Reliability Corp.) report on the March 13, 1989 storm explained "As the solar particles arrived at the earth, they caused rapid fluctuations of the earth’s Geo-Magnetic Field. This, in turn, produced an induced earth-surface voltage and Geo-Magnetically Induced Currents, or GICs. GICs appear as quasi DC current to the grid electric system. The consequences of this DC current are to drive transformer cores into saturation. This, in turn, causes significant heating from stray flux and can damage the transformers. Seven static VAR (Volt Ampere Reactor) compensators on Hydro-Quebec’s giant La Grande high-voltage transmission network shut down in a matter of seconds. Induced direct current from the solar storm caused the transmission system voltage to drop, frequency to rise, and the transmission lines to trip off. The balance of the Quebec transmission system collapsed in seconds. It took nine hours to restore 18,000 MW of power to the network. The solar storm left considerable wreckage in its path, including two La Grande generating station "step-up" transformers, thyristors, and capacitor banks at several units. In addition, many static VAR compensators across the system were damaged or destroyed." The total cost of the storm was estimated to be $6 billion.
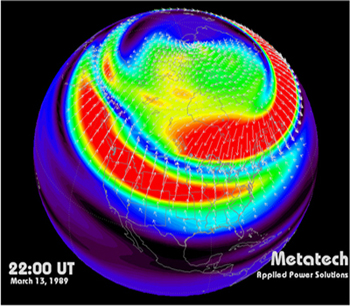
The storm map above was re-constructed using many sensor readings across the United States, Canada and Europe during the 1989 storm. The red areas are Electrojets of intense Ionosphere currents, the lower red area being the "Eastward Electrojet" and the higher red one the "Westward Electrojet". The magnetic effects went as far south as the northern Arizona and Florida borders. The heaviest Electrojet concentration was over eastern Canada where the most damage occurred.
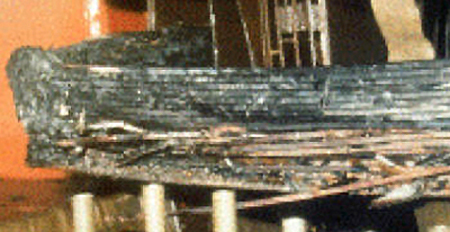
However, the damage was not confined to the Canadian system. The most chilling effect of the storm was a thousand miles away in New Jersey, where the 1.2 MW Salem One Nuclear Plant sits on an island at the mouth of the Delaware River. The solar storm induced heavy currents on the 500 kV (500,000 Volt) transmission system, which damaged the Salem "step-up" transformer, resulting in large melted masses of copper (shown below). The transformer’s insulation confined the damage such that the Nuclear Plant did not trip off. Across the United States from coast to coast, over 200 power grid problems erupted within minutes of the start of the storm. Fortunately, none of these caused a blackout. In England, the 1989 storm caused damage to two 400 kV transformers. For a good non-technical background on solar storms see the Power Magazine Article. Top
The Vulnerable Grid
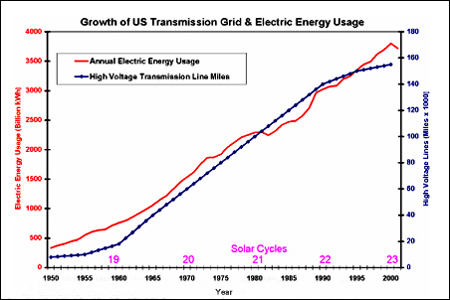
The chart to the left shows the 10 times growth of high-voltage transmission lines in the US over the last fifty years. High-voltage lines range from 345 kV to 765 kV (345,000 to 765,000 Volts) which were pretty much nonexistent in 1950. With the growth in installations comes a proportional increase in vulnerability as high voltage lines are much more susceptible to GICs (Geo-Magnetically Induced Currents) than lower voltage lines. High voltage lines are more efficient (lower transmission losses due to less resistance) but the lower the resistance, the more susceptible transmission lines are to GIC currents rising up from the earth through ground connections.
In general, higher voltage lines are used for long distance transmissions, which have increased dramatically as back up redundancy has spread in order to minimize blackouts. The NERC rule is "the loss of any single generation station or transmission line shall not cause a system collapse." Some transmission lines cross state boundaries and even
country boundaries. Hence, very large regions of North America are now interconnected. The loss of electricity impacts other infrastructure services such as: water supplies, food and medical supplies, heating and air conditioning, phone services, transportation, etc. The impacts of a major disruption are far reaching and very expensive.
Transformers are the most vulnerable link as far as grid damage from a GIC storm is concerned. Transformers are designed to handle AC currents, but a GIC, while an alternating current, has a cycle so long (minutes vs. one-sixtieth of a second) that it appears to the device as a DC current. When this happens the transformer core will saturate in one polarity, either plus or minus. The transformer will then overheat, and if dramatically overheated, the copper core can melt as shown in the picture above of the "generator step up" (GSU) transformer at the New Jersey Salem One Nuclear Plant during the 1989 Storm.
GSUs are particularly susceptible to GIC currents because they operate close to 100% capacity versus 50% for transmission transformers. Other equipment can also be damaged, but transformers are the most vulnerable. While electrical networks can handle the loss of one transformer, the worst case scenario is the loss of several simultaneously as happened in Quebec in the 1989 Storm. This brought the whole network down for 9 hours. Other problems with transformers, especially "step up" transformers, is that they are generally customed designed, very few have back up spares, and they may take up to a year to replace from foreign sources (no domestic US suppliers). Thus, a very severe storm could heavily damage a regional grid system for months. Top
Mitigating GICs
There are four things that can be done to mitigate the effects of GICs:
- Harden the grid to "completely block" GICs.
- Harden the grid by "reducing" GIC currents.
- Implement a program to provide "spare transformers" in case of damage.
- In conjunction with forecasting techniques, implement "operational procedures" to avoid widespread blackouts.
Hardening The Grid
Completely Block GICs
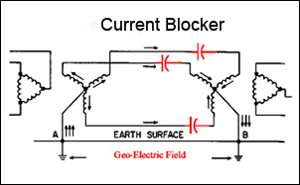
Since GICs are quasi DC currents, a capacitor can be used to block the current. Shown at the left are three blocking capacitors (in red) needed to completely block GICs on a three phase transmission line. There will be zero GIC current flow in this configuration. In fact in Quebec after the 1989 Storm, Hydro-Quebec installed this configuration of capacitors in high voltage transmission lines at a cost of $1.2 billion.
Because transmission blocking capacitors must be capable of carrying very high AC voltages and high currents, they are very expensive. It would be "prohibitively expensive" to install blocking capacitors on all high voltage lines in the US. However on the Western Grid, approximately 50% of the lines are protected by blocking capacitors. But since the grid is so interconnected for redundancy back up reasons, it is estimated that GICs would only be reduced by 12% to 22%.
Reduce GIC Currents
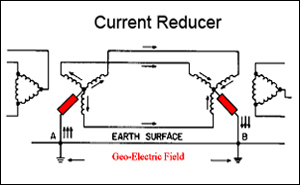
A more practical approach from a financial perspective has been suggested by John Kappenman, Solar Storm Expert at Metatech. In the "ground" connection of a transformer, where the GICs enter the grid, a low ohm resistor (less than 8 ohms) can be inserted as shown (in red) at the left. While a resistor component does not block 100% of the current like a capacitor does, it will reduce the GIC current by 60% to 70% at a reasonable cost.
One of the questions raised by this approach is whether or not transmission lines will be properly grounded after adding the resistors. Analysis of this question indicates that as long as low ohmic resistors are used, the transmission lines meet the IEEE guidelines. This approach has been recommended to NERC by John Kappelman . Top
Operational Tactics
Provide Portable Spare Transformers
Large transformers are very reliable devices. However, in the event of a GIC transformer failure, six months or longer may be required to procure, transport, install, and energize a replacement. Due to the high capital cost of these devices ($1 to $5 million each), utilities store a limited number of spare transformers. An additional approach would be for utilities to pool all of the spares regionally or nationally, so that a larger number would be available for replacement in the event of significant GIC damage. The goal of the NERC transformer Spare Equipment Database (SED) program is to provide a means to connect utilities that need replacement transformers with those that have spares available.
High voltage transformers installed around North America vary significantly in their design, site-specific installation configurations, and compatibility with ancillary equipment. Many are custom built for a particular installation. As a result, the SED program is useful for a utility, only if it can identify an identical spare that is available. Another limitation is that only about one percent of the current 2000 high voltage transformers are currently replaced each year in North America (about 20 transformers). Worldwide production capacity is less than 100 units per year. Therefore, if a large number of high voltage transformers were damaged in a short period of time, obtaining replacements quickly would be a challenge. Hence, a more comprehensive solution is needed to meet the need for spare transformers.
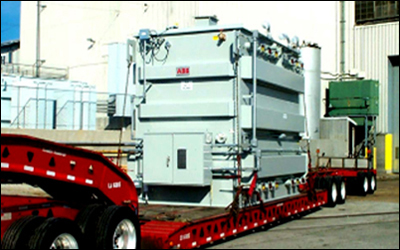
To address this need, the Electric Power Research Institute (EPRI) and the Department of Homeland Security (DHS) have embarked on a project called the Recovery Transformer (RecX) Program. The mission of this program is to design, build, and test prototypes of a new type of emergency extra high voltage (345 kV or greater) spare transformer. These mobile transformers can be rapidly transported to, and energized at, damaged electric grid substations. The first three prototype single phase transformers have completed factory testing and are being field tested at CenterPoint Energy in Houston, Texas. One of them is shown above on a truck ready to go.
Update February, 2014. A portable high-voltage transformer called RecX, sits ready to go on its site in Houston. The RecX transformer was installed at Houston's CenterPoint Energy in March 2012 for trials. "It's performing as designed," Electric Power Research Institute's (EPRI's) Project Manager Richard Lordan said. "Everything is beautiful." RecX was completed in 2012 by ABB Inc. in St. Louis in collaboration with the Department of Homeland Security and the EPRI, but the recovery transformer is still one of a kind. "In a worst-case scenario, parts or all of cities could be without power for months unless something were done quickly. Portable transformers could get power restored to critical services until permanent replacements were in place" said Lordan.
But while government agencies and utility companies are working on plans for stockpiling mobile replacement transformers, there is not a consensus about how they should share the costs and there has not been any real progress. "There is a risk that when -- not if -- a cyberattack does effectively disrupt a power grid, we will suffer strategic surprises," said Paul Stockton, former assistant secretary of homeland defense for the Defense Department. It happened with Sandy when, he said, Defense Department officials were surprised by the extent of the damage to energy facilities. "I hope it won't take the equivalent of a Hurricane Sandy or worse to kick-start consensus building," he added. Top
Forecasting Storms
SWPC - In the United States, the main source of space weather information is the Space Weather Prediction Center (SWPC) located in Boulder, Colorado. SWPC is the service center of the National Oceanic and Atmospheric Administration’s (NOAA) National Weather Service.
The SWPC provides forecasting information for solar storms and also monitors events once a storm hits the earth's atmosphere. SWPC scientists incorporate satellite based sensor data, as well as data from optical observatories around the world. SWPC forecasts space weather on time scales of hours to days by analyzing current conditions, comparing current conditions to past conditions, and using forecasting models.
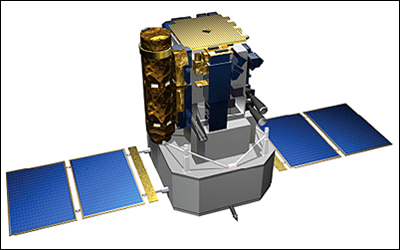
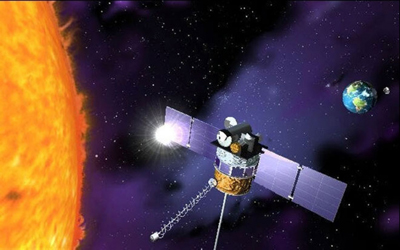
SWPC uses several satellites to monitor solar events. Launched in 1995, SOHO, shown at the left, currently operates at the L1 Lagrange Point about one million miles from earth, which is the point between the sun and the earth where the gravitational pull from the two bodies counter balance.
See the illustration at the left. (There are a total of 5 Lagrange Points - L1 through L5). SOHO's mission is to study the sun from deep in its core to the outer Corona. SOHO provides "magnetograms" and CME pictures of the sun's surface which are used for SWPC forecasts.
Using input from SOHO as the storm leaves the sun, the SWPC software produces a three dimensional model of the CME and then predicts when it will strike the earth, if at all. The size, speed, timing, strength and exact direction of the storm are critical first estimates.
Most storms just fly off into outer space with only 1% striking the earth. Originally intended to operate for 2 years, SOHO has greatly exceeded its life expectation and is now 20 years old.
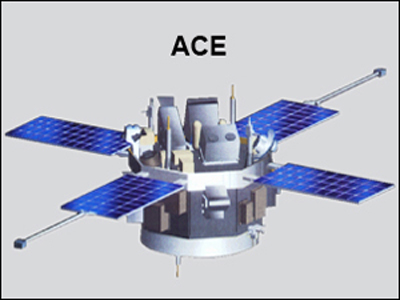
Launched in 1997, ACE, pictured at the left, also operates close to the L1 Lagrange Point. Its mission is to study energetic particles from the solar wind and storms as they pass by. ACE measures the actual CME's speed, density and magnetic field. Since the storm travels approximately one million miles per hour and ACE is about one million miles away, the lead time of the forecast is about 40 to 60 minutes. But, this is enough time for grid system operators to take some types of action.
ACE has sufficient propellant to operate until approximately 2024. Over time these satellites drift and periodically they must be re-positioned at the L1 Lagrange Point using stored fuel. However, ACE's instruments are now outdated and a replacement satellite is in process of replacing ACE. ACE, however, will remain in place as a back up.
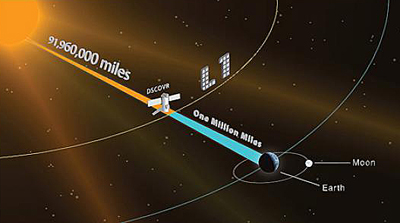
The Deep Space Climate Observatory (DSCOVR), pictured at the left below, is an earth observation and space weather satellite launched by SpaceX in February, 2015 from Cape Canaveral. DSCOVR was originally proposed by Vice President Al Gore in 1998 for the exclusive purpose of keeping tabs on earth.
He named it “Triana”. It would also sit at the L1 Lagrangian point in order to give Triana a constant sunlit view of the earth so it could monitor climate changes as ocean ice, clouds and vegetation waxed and waned. However, in 2001 the Bush administration canceled the project and the already built satellite was put in storage.
But in 2011, the Obama administration renamed the mission DSCOVR, repositioned it to focus mostly on solar activity, and moved it from NASA to the National Oceanic and Atmospheric Administration (NOAA). DSCOVR will replace ACE as the main satellite to detail solar storms as they come through. The U.S. Air Force funded the launch vehicle through their launch services contract with the commercial space company SpaceX. NOAA became responsible for mission operations.
Under a series of interagency agreements, NOAA funded NASA to refurbish the satellite for a primary "space weather mission" while retaining most of the instruments to perform climate monitoring as a secondary role. Three instruments will measure the solar wind on the DSCOVR mission: a Faraday cup to monitor the speed and direction of positively-charged solar wind particles, an electron spectrometer to monitor the motion of negatively-charged electrons, and a magnetometer to monitor the alignment of magnetic fields. DSCOVR's magnetometer will gather data at the rate of 50 times per second which compares to ACE's 6 times per second. The other instruments are also much faster than ACE's.
DSCVR is at the L1 Lagrange Point, where gravitational forces balance between the sun and earth. In July, 2016, earth’s new spacecraft was fully operational. At L1, a spacecraft can detect looming space weather storms before they strike earth providing valuable lead time for NOAA’s space weather alerts and forecasts.
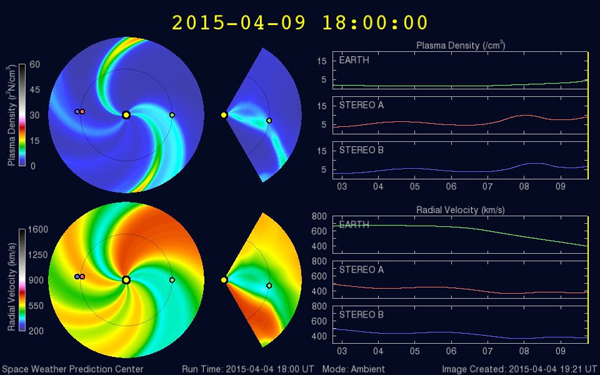
WSA-ENLIL Software. ENLIL was the Sumerian god of wind. WSA-Enlil is a fairly recent large-scale model of the Heliosphere used by the SWPC to provide 1 to 4 day advance warning of solar coronal mass ejections (CMEs) that could cause geo-magnetic storms. WSA-ENLIL went live in October of 2012.
In the illustration to the left from NOAA's SWPC in Boulder, Colorado, the top row plots show predictions of the solar wind density. The bottom row plots show solar wind velocity.
ENLIL is a time-dependent three dimensional physics-based mathematical model of the Heliosphere developed by D. Odstrcil of George Mason University and the NASA Goddard Space Flight Center Weather Laboratory. The WSA-Enlil software has two major parts: a "semi-empirical" model of the sun that works out the currents of the solar wind around the sun and a 3D magneto-hydrodynamic (MHD) numerical model that predicts how the charged particles will march towards the earth. The solar plasma's, mass, speed, energy density, and magnetic fields are measured by L1 NASA satllites and fed into the WSA-ENLIL model. The model then predicts the exact path, speed, and arrival time of the CME when it will intersect with the revolving earth.
The old software prediction model meant scientists could predict the timing of when the sun's eruptions would hit the earth within a 30-hour window, while WSA-ENLIL allows them to predict it within a 12-hour timeframe. See the SWPC WSA-ENLIL Page for a current forecast.
An actual three day SWPC forecast for April 5th, 2015 is shown below:
Product: Forecast Discussion
Issued: 2015 Apr 05 1230 UTC
Prepared by the U.S. Dept. of Commerce
NOAA Space Weather Prediction Center

Solar Activity

24 hr Summary...

Solar activity remained at low levels. The largest flare of the period  was a long duration C3/1f
hyderflare observed at 05/0007 UTC. This event  was associated with a 23 degree long filament eruption
centered near  S29E28. The filament was observed in SDO/AIA 193/304 and GONG imagery  lifting off
beginning at 04/2225 UTC and was no longer visible by about  04/2330 UTC. The eruption appeared to
propagate along the filament  channel from the southeast to northwest and was accompanied by coronal
dimmings.

Associated with this eruption was a Type II radio emission at 04/2319  UTC with an estimated shock
velocity of 933 km/s. LASCO coronagraph  imagery observed a fast-moving CME off the SE limb, first
visible at  04/2336 UTC in C2 and 05/0006 UTC in C3 with estimated plane-of-sky  speeds of 758 km/s
and 770 km/s, respectively. Analysis and subsequent  WSA-Enlil model output suggests the main body
of the CME will pass to  the south and east of Earth, but a glancing blow from the shock front is
expected to impact Earth mid to late on 07 April.
Sunburst Network
The Sunburst Network, lead by EPRI, was formed in 1990 to monitor and collect data on Geo-Magnetically Induced Currents (GICs) after the solar storm of 1989. The Network consists of a number of collaborating utilities that collect data on GICs and then share that data on-line in near-real time. The system records information such as transformer phase currents, voltages, neutral currents, hotspot temperatures, as well as electric and magnetic fields. The Sunburst Network now has over 20 years of GIC data. Power operators can view their own GIC data on line during a storm and by sharing the data with other local utilities, they can obtain a larger view of the storm in process. The Sunburst Network automatically sends an email alert to all system operators when a GIC event occurs (more than two sites reporting significant GICs in progress).
Monitoring one's own site allows operators to determine exactly when transformer saturation occurs and when there is the possibility of damage.
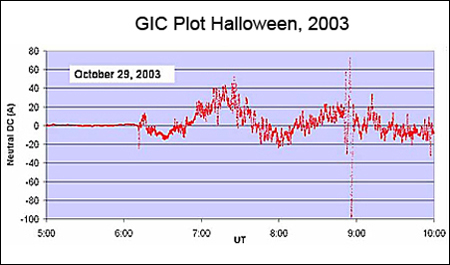
The plot left above is a typical GIC plot captured by the Sunburst Network from the Halloween Storm which started shortly after 6:00 am October 29, 2003. Some interesting points are: While the maximum currents were quite large (+75 and -100 amps) they were of such short duration that no damage was done to the transformer. From about 6:15 to 7:40 there was a modest positive current of about 15 amps on average which would result in heating of the transformer, but not likely enough to cause overheating or damage. Notice also that at times the current is positive and then it goes negative for a while. A change in polarity has no extra affect on heating or saturation.
The goal of collecting data like this is to help create guidelines for operators faced with making real time decisions. NASA and EPRI request that all utilities north of the 30th parallel, especially above the 35th parallel, join the Sunburst Network to increase the data base and to develop tactical guidelines for operatores who have to deal with GICs in real time.
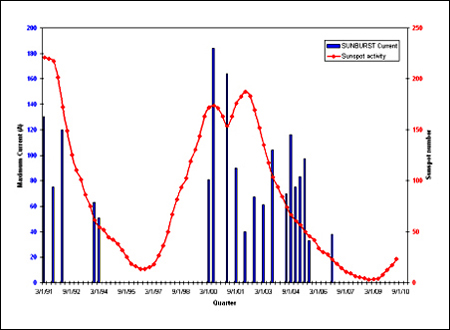
The chart above is a plot of amps of maximum solar storm GIC neutral currents in blue and the quarterly Sunspot Cycle data in red as recorded by the Sunburst Network. One can see that in the last 20 years, storms of any measurable magnitude have occurred during the maximum and back end of the cycles. None occurred during the minimum activity periods. Also during Cycle 23 (1997 to 2008), there was zero activity at the front end of the cycle. One cycle is not enough to declare a trend, but the front end activity bears watching as we are now in the middle of Cycle 24. Very interesting data. See the Sunspot Cycles Page for more Sunspot information. Top
Operating Guidelines
SWPC categorizes solar storms on a K-scale that ranges from 1 to 9. The actual index used is the Kp index which is an average of a number of monitoring points. When the SWPC forecasts a storm greater than Kp 6, operators swing into action.
Actions an operator can take after a warning but before a storm actually hits are:
- Discontinue non-critical maintenance work.
- Restore out-of-service transmission lines if possible .
- Reduce loading on high voltage transmission lines to 90% of normal.
- Bring standby generators on line.
- Monitor key lines and transformers with increased vigilance.
Actions an operator (or Reliability Co-ordinator) can take in the middle of a storm are:
- Increase "reactive" reserves (generators, capacitor banks, static VAR compensators, etc.).
- Reduce and maintain system voltages in acceptable ranges.
- Decrease loading on susceptible transformers if possible.
- Re-dispatch electrical generation if possible.
- As a last resort, remove affected transmission equipment from service if excessive GICs are measured or unusual equipment behavior is experienced.
For a very thorough Solar Storm discussion see Geo-Magnetic Disturbances (GMDs) from NERC October, 2011. Top
Are There Giant "Killer" Storms?
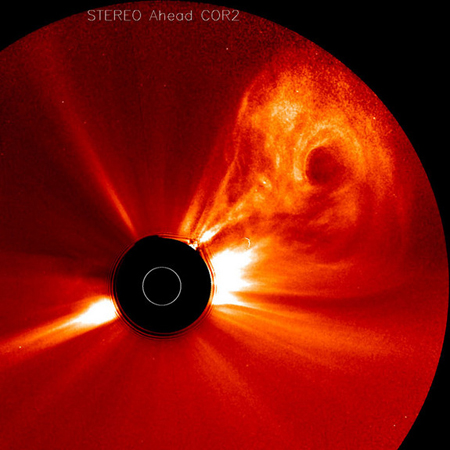
The quick answer is "no"! To the left is an enormous Coronal Mass Ejection (CME) recorded by NASA on February 26, 2011. Although gigantic, it was pointed harmlessly "away" from the earth. Some people worry that such giant "killer solar CMEs" could hurl enough energy to destroy the earth. However, even the biggest solar CMEs are not powerful enough to destroy the earth. And, as far as the record is known, there have never been any deaths attributable to solar storms.
This is not to say that space weather doesn't affect our planet. The explosive heat of a solar flare can not make it all the way to our planet, but electromagnetic radiation and energetic particles certainly can. Solar flares can temporarily alter the upper atmosphere creating disruptions with signal transmission from GPS satellites to earth causing them to be significantly off.
The CME phenomenon can be more disruptive. If the CME size, shape, speed, direction, angle, and the timing of the orbital rotations are just right, a CME explosion can propel bursts of particles and electromagnetic fluctuations into the earth's atmosphere. These magnetic fluctuations can induce electric current fluctuations in the ground's upper crust that can blow out transformers in power grids (see The Vulnerable Grid above). The CME's particles can also collide with crucial electronics onboard space satellites and disrupt their systems.
In our increasingly technological world, where almost everyone relies on cell phones and GPS controls (not just in car map systems, but also in airplane navigation equipment and extremely accurate clocks that govern financial transactions) serious CME damage can be incurred. But the earth and almost all of its people will survive. Some scientists suggest that the damage from a super giant CME would be similar to that of a major hurricane.
However, people can protect themselves from a hurricane with advance information and proper precautions. During a hurricane watch, a home owner can seal up the house, turn off the electricity and get out of the way. Similarly, scientists at NASA give warnings to electric companies, spacecraft operators, and airline pilots before a CME hits the earth so that these groups can take proper precautions. Improving predictions, the same way weather predictions have improved over the last few decades, is one of the reasons NASA studies the sun and space weather.
Top