
What are Sunspots?
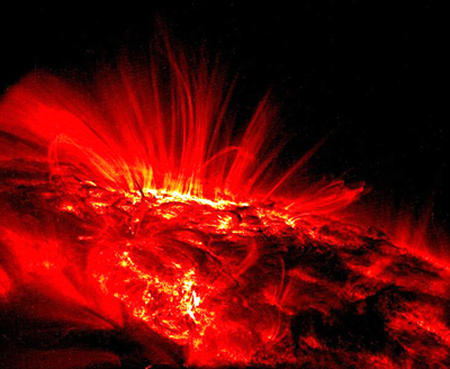
Sunspots are a temporary phenomenon on the surface of the sun (the Photosphere) that appear as dark spots when viewed from afar. They are caused by intense magnetic activity, which inhibits plasma gas convection flow in the Convective Zone just beneath the sun's surface. These disturbances form areas of lower surface temperatures which appear dark. However, these spots are not really dark, but quite bright. They appear dark only when compared to excessively bright areas nearby. When examined under ultraviolet light conditions, it can be shown that the "dark spots" actually have temperatures of thousands of degrees, 4,200°C versus 5,500°C in surrounding areas. Sunspots expand and contract as they move in the plasma flow across the surface of the sun. Some are as wide as 50,000 miles in diameter, which is roughly 8 times the diameter of the earth. The image to the left was taken by the NASA space orbiter TRACE and shows in some detail the interior makeup of a sunspot. One can see the "swirls" of magnetic rotation in the plasma which is not completely dark. Sunspots can exist for a few days or for a few months. It turns out that sunspot "activity" is a good barometer of the overall activity of the sun and can be used to make predictions about the future activity of the sun. This is invaluable for astronauts, spaceships, satellites and other space related phenomenon. Sunspot Cycles are also a useful tool for predicting Space Weather in the vicinity of earth. Top
Counting Sunspots
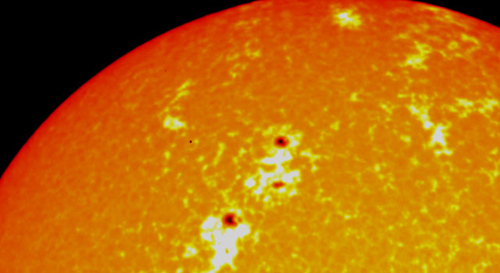
Counting sunspots is not as easy at it may at first appear. Depending where on earth you are on any given day may reflect different weather conditions and counts may vary by location. A location with some cloud cover may not reveal as many (if any) sunspots compared to a location with a perfectly clear view. If you looked at the sun through a pair of filtered low power binoculars, you might be able to see two or three large spots. A person peering through a high-powered telescope might see 10 or 20. A powerful space based observatory could see maybe 50 to 100. Then there is the matter of how you count spots when there is a large group in a relatively small given area. It is easy to have a wide variety of counts for the same group. Which count is the "correct" sunspot number?
Sunspot "cycles" were first observed in 1843 by Samuel Schwabe, who after 17 years of observations, noticed the cyclical pattern. The idea of standardizing the method of counting sunspots was initiated by Rudolf Wolf in 1848 and his counting methodology has been continued to this day. The daily count is called the "Wolf Number". The formula is R = k(10g + f). Where "R" = the Wolf number of spots. "g" is the number of groups of spots and this number gets multiplied by 10 (Wolf's average per group) no matter how many spots are actually seen in a particular group. When counting spots in a group each person could come up with a different number and who knows whose number is more correct. So the methodology suggested by Wolf was to standardize the count to 10 sunspots per group and this has worked very well for a 150 years. "f" is the number of individual spots observed counting each group as one. The number "k" is a factor that represents the observatory factor for a particular telescope and observer.
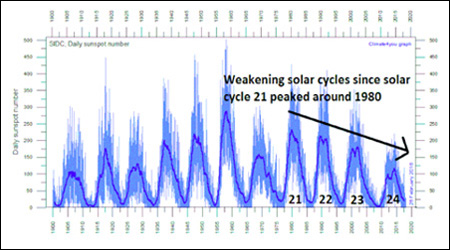
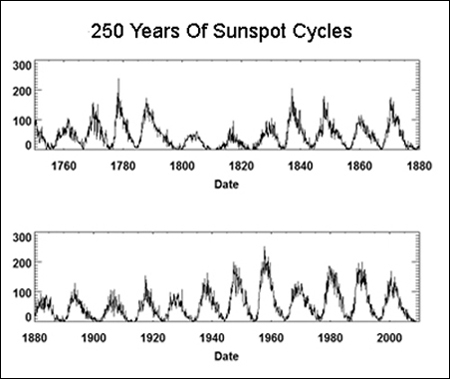
In the modern age, a large number of observations from all over the world are reported each day and they are averaged. After a while, a value for k can be computed for each observer relative to the average. While there are several versions of the daily count calculated by different groups, the Wolf number is the predominant methodology. When looking at sunspot counts over hundreds of years of data, the daily counts are usually averaged into a monthly number to keep the graphs manageable. See the blue chart above showing recent sunspot cycles as of February, 2018 (close to the end of Cycle 24). Top
Sunspot Cycles
Sunspots have been recorded since Galileo in the early 1600's. However it was about 150 years later that Schwabe observed the cycles in the sunspots to be approximately 11 years. And five years later, Wolf standardized the methodology for counting. We can now summarize the amplitude of the cycles from an exremely large data base. The monthly daily average number of sunspots increases from almost zero to over 100 and then decreases to near zero as the next cycle begins.
The temperature chart below left was constructed byHenrick Svensmark over the last 1,100 years using carbon 14 tracings from
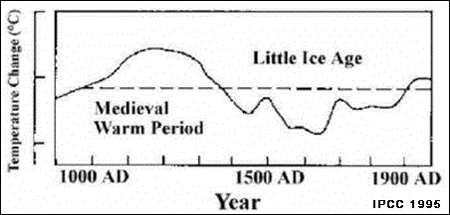
tree rings. Carbon 14 concentrations are lower during sunspot high periods and higher during sunspot low periods (the opposite of temperatures). Notice that the earth went through a warming phase in the Middle Ages from 1100 to 1300 which was much warmer than today with no major ill effects. Then the earth went through the Little Ice Age from 1500 until 1700 and has been modestly warming ever since.
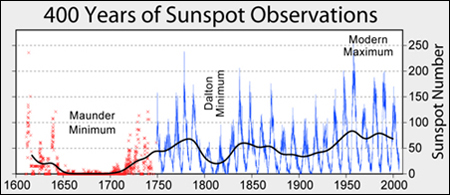
Maunder Minimum. The Maunder Minimum is one of the great sunspot mysteries which lasted 70 years starting about 1650. Sunspots were rarely observed during this time but it was not for the lack of attention. Accurate records were kept during this period even
though the sunspot cyclical nature was not yet known. Most researchers are convinced that the Maunder Minimum was the cause of the Little Ice Age which occurred at the very same time. This is direct evidence that the sun's variations have a significant influence on the earth's climate. (See Solar Warmingsection for more information on this subject.) For reasons that we do not understand, the cycles revived themselves around 1750 and have continued their 10.7 average yearly period ever since.
The sunspot cycles have been accurately measured for the past 250 years. The chart at the left shows cycles 1 through 23. In 1919 George Hale showed that the sunspot cycles coincided with the sun's magnetic cycles. However the magnetic cycle was a 22 year cycle, double the 11 year sunspot cycle.
Sunspots are in general a very good measure of the sun's internal magnetic activity. It is now believed that the twisting magnetic action in the plasma Convection Zone below the sun's surface causes both sunspots to form and the sun's magnetic field to periodically reverse itself.
The earth's magnetic field also reverses itself, but only about once every million years. These reversals are recorded in rocks and their signatures can be seen in striped magnetic formations on the ocean floor. For an interesting short video of a complete sunspot cycle, see the NASA Cycle 23 Video. Top
The Maunder Butterfly Diagram
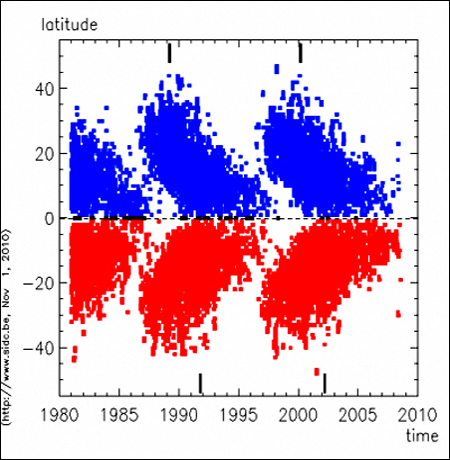
On the left is a short and simplified version of what is known as the Maunder Butterfly Diagram first constructed in the early 1900s. The sun is divided into latitudes just like the earth with the sun's equator being 0 degrees and the poles being +90 and -90 degrees. The x-axis is time expressed in years. Each dot represents the latitude where each sunspot activity was recorded. Blue dots are in the northern hemisphere and red dots are in the southern hemisphere. The shape of the distributions reminds one of the wings of a butterfly.
One noteworthy observation is the absence of sunspots above 40 degrees in either hemisphere. However, the most important piece of information is that at a beginning of a cycle the sunspots are mostly in the 20 to 40 degree ranges in both hemispheres. As the cycle comes to an end the sunspots mainly occur close to the sun's equator. This means that over time there is a plasma flow going on beneath the sun's surface from the outer portions of both hemispheres towards the equator. This is a very important point in understanding the flow and magnetic activity of the Convective Zone. All solar events are strongly influenced by the solar magnetic cycle, since the magnetic cycle serves as the "energy engine" for all solar activities. The sun's dynamic magnetic field defines the Photoshere's features, the Chromoshere, the Corona, Solar Prominences and CMEs, the Solar Wind and eventually the shape of the Heliosphere. It is noteworthy that the sun's magnetic field and cycle effects our whole solar system.
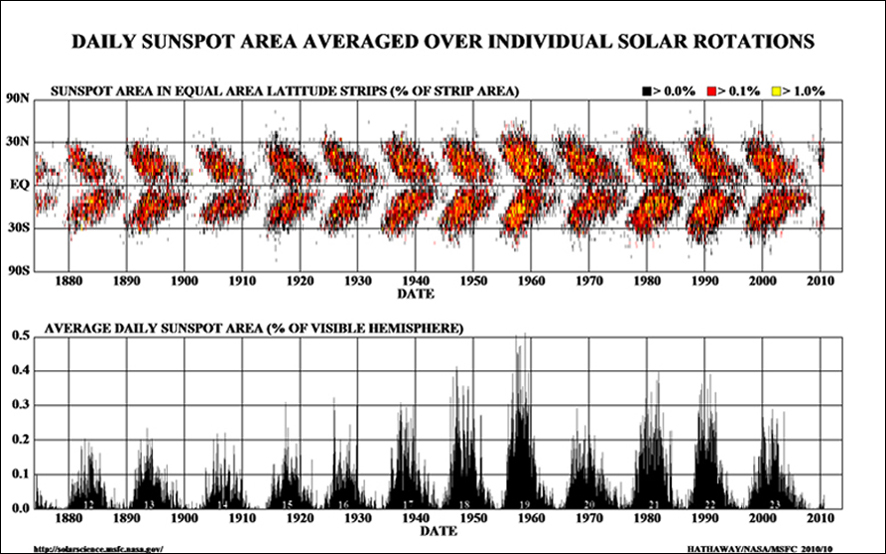
The complete Butterfly Diagram is shown below.
 Top
Top
The Sun's Conveyor Belts
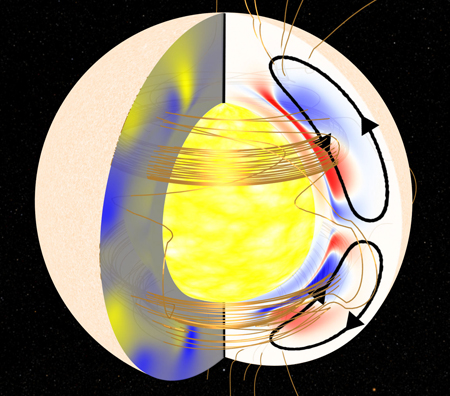
At the left is an artist's conception of what are commonly called the sun's conveyor belts. The official name is the Meridional Flows, which are "rivers" of plasma flow under the sun's surface in the Convection Zone. The belts are massive hot plasma currents within the interior layers of the sun. Both branches of the conveyor belt take about forty years to complete one revolution. The flow rates are relatively slow - about 20 to 30 miles per hour (the speed of a good bicyclist). The speeds are calculated from data collected by the NASA SOHO solar observatory. The top of the belts skim the sun's surface sweeping up knots of solar plasma magnetism and propelling them towards the poles. SOHO (the Solar and Heliospheric Observatory) is able to track these knots and calculate their speed. It is like tracking the speed of twigs and leaves floating down a river says David Hathaway, NASA Solar Physicist. As the currents near the poles they take a deep dive down to the bottom of the Convection Zone and proceed deep under the surface towards the equator where they re-surface.
Recently, 2004 to 2010, the conveyor belt has been speeding up. Simultaneously, the last sunspot low cycle, 2008 to 2009, was longer and quieter than usual. It was previously thought that a faster conveyor would cause more sunspot activity, but the current data contradicts that theory. NASA's Solar Dynamics Observatory (SDO), launched in February, 2010, will be able to "look" inside the sun's interior by recording the sun's own acoustical waves generated by its internal turbulence. NASA scientists can transform the data into visual pictures which will allow them to study the conveyor belt and other internal phenomenon in greater detail. Perhaps SDO will be able to solve the speed up dilemma. See NASA Solar Current Speeds Up. Top
Sunspot Cycle 25 Prediction
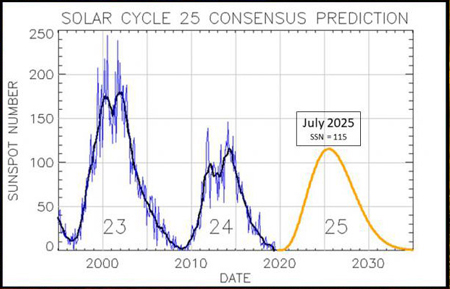
The current sunspot cycle is number 25, which began in January of 2020. It is forecast to be a small one with a peak "smoothed sunspot number" (SSN) of about 115 in the year 2025.
Small sunspot cycles mean the earth is going through a "cooling period" as far as the influence from the sun is concerned. (See the "Dalton Minimum" above during the Revolutionary War with Briton in the "Sunspot Cycles" section. Remember how cold it was at Valley Forge for George Washington and his troops.) On the other hand, today we have major global warming effects from "greenhouse gases" tending to warm the atmosphere.
It takes a few years for the cooling effects from the sun to take hold because of the heat retention ability of our oceans. Based upon magnetic field measurements 120,000 miles beneath the sun’s surface by NASA and the University of Arizona, Cycle 25 will be a weak cycle similar to Cycle 24. Therefore the coming decade will be very interesting. What conditions will dominate - the sun's cooling or the greenhouse gases warming?
Forecasting peak solar activity is important for NASA because their space missions and satellite orbits must be planned years in advance. In addition large solar storms play havoc with satellite communications, GPS systems, radio communications and other high tech devices. Severe solar storms can create magnetically induced huge currents on the grid which can melt giant grid transformers. This actually happened in 1989 and 2003 damaging transformers in New Jersey, Canada, and Great Britain. These huge transformers can take up to a year to repair or replace. NASA has implemented a warning system called "Solar Shield" which would warn utilities of impending danger. See The Vulnerable Grid on the Solar Storm page.
Top